
Display geo location map for NGINX traffic logs in Kibana
Table of Contents
- Summary
- Elasticsearch 7
- Kibana
- Configuration
- HAProxy on pfSense
- Filebeat on client host
- NGINX
- Network geo location map
- Summary
Summary
There are 3 things to remember and configure in order to have geo location map working:
- Use “forwardfor” option on pfSense HAProxy TLS frontend
- Enable filebeat NGINX module and point particular log files
- Define custom NGINX log format
This guide relates to Ubuntu Linux setup.
Elasticsearch 7
First install Elasticsearch 7 as follows.
wget -qO - https://artifacts.elastic.co/GPG-KEY-elasticsearch | sudo gpg --dearmor -o /usr/share/keyrings/elasticsearch-keyring.gpg
sudo apt-get install apt-transport-https
echo "deb [signed-by=/usr/share/keyrings/elasticsearch-keyring.gpg] https://artifacts.elastic.co/packages/7.x/apt stable main" | sudo tee /etc/apt/sources.list.d/elastic-7.x.list
sudo apt-get update && sudo apt-get install elasticsearch
Note: for more resilent setup install more than one Elasticsearch server node and enable basic security. For sake of clarity I will skip these two aspects which will be covered by another article.
Kibana
Then install Kibana to have UI for Elasticsearch:
wget -qO - https://artifacts.elastic.co/GPG-KEY-elasticsearch | sudo gpg --dearmor -o /usr/share/keyrings/elasticsearch-keyring.gpg
sudo apt-get install apt-transport-https
echo "deb [signed-by=/usr/share/keyrings/elasticsearch-keyring.gpg] https://artifacts.elastic.co/packages/7.x/apt stable main" | sudo tee /etc/apt/sources.list.d/elastic-7.x.list
sudo apt-get update && sudo apt-get install kibana
Configuration
Now be sure to configure both Elastic and Kibana. For Elastic it is /etc/elasticsearch/elasticsearch.yml configuration file. Be sure to set the following (change 0.0.0.0 with your local IP address):
network.host:   0.0.0.0
http.port:      9200
discovery.type: single-node
To enable and start Elasticsearch server:
sudo systemctl enable elasticsearch
sudo service elasticsearch start
Now configure Kibana. Configuration file location is /etc/kibana/kibana.yml. Replace “0.0.0.0” with your local IP address:
server.port: 5601
server.host: "0.0.0.0"
elasticsearch.hosts: ["http://0.0.0.0:9200"]
Enable and start Kibana server:
sudo systemctl enable kibana
sudo service kibana start
Be sure to check if both Elasticsearch and Kibana are up and running with service or systemctl. If everything is fine proceed to setup Filebeat, Packetbeat on client hosts. There is separate guide how to do this. In beats configuration file point to Elasticsearch server you just installed.
HAProxy on pfSense
Example setup includes gateway, which is pfSense with HAProxy package. Configure two frontends, one for HTTP at 80 and one for HTTPS at 443. On HTTP frontend configure
Action http-request redirect
rule: scheme https
On HTTPS configure certificate and check SSL Offloading. Of course you need to load this certificate in System, Cert. Manager. Configure your backends and select it on HTTPS frontend. Now, go to HTTPS frontend and check the following:
Use "forwardfor" option
It is required to be able to read client IP in backend NGINX.
Filebeat on client host
On client hosts install filebeat package. There is separate guide for this one. Edit configuration file, which is /etc/filebeat/filebeat.yml:
filebeat.inputs:
  enabled: false
And then setup and enable NGINX module:
filebeat setup
filebeat modules enable nginx
Now, you are good to go with delivering log files, but first you need to point them in the configuration at /etc/filebeat/modules.d/nginx.yml:
- module: nginx
  access:
    enabled: true
    var.paths: ["/var/log/nginx/app.log"]
You can now enable and start filebeat:
sudo systemctl enable filebeat
sudo service filebeat start
NGINX
In the http section in configuration file /etc/nginx/nginx.conf add new log format:
log_format mydefault '$http_x_forwarded_for - $remote_user [$time_local] '
                     '"$request" $status $body_bytes_sent '
                     '"$http_referer" "$http_user_agent"';
You can use it in application configuration file at /etc/nginx/conf.d/app.conf in the server stanza:
access_log /var/log/nginx/app.log mydefault;
Restart your NGINX server and go to Kibana to explore your data. You need to add this log format, in order to handle client IP which is present in $http_x_forwarded_for variable. This format as close as possible to the default one.
Network geo location map
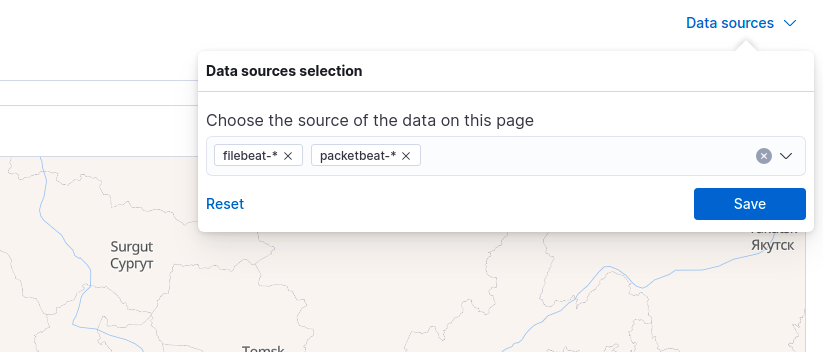
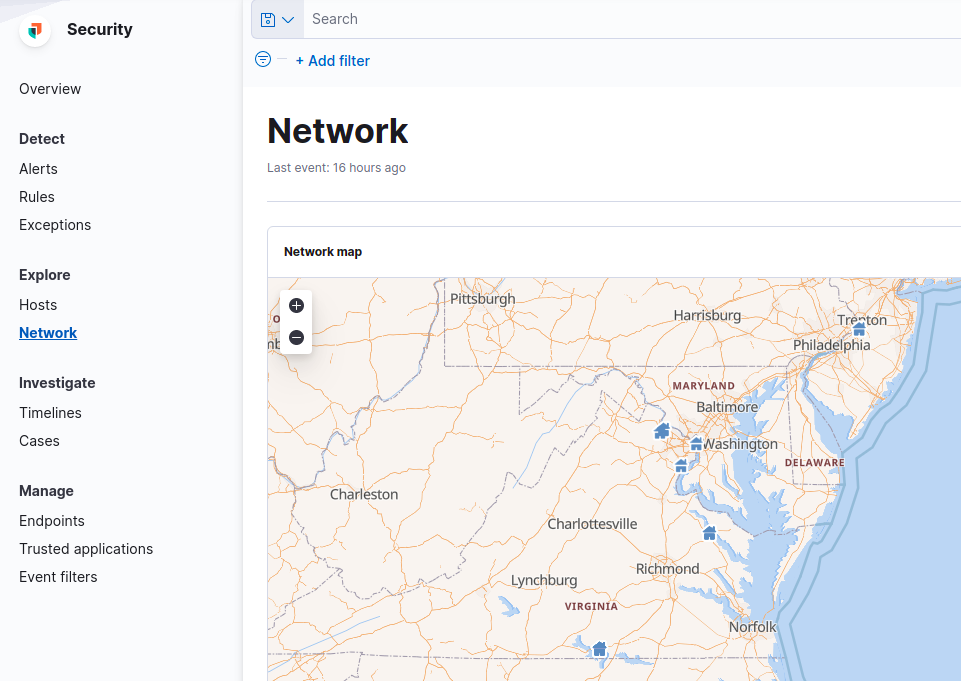
If everything went fine which is installting Elasticsearch, Kibana, beats on your client hosts and configuration of HAProxy, NGINX, then you can open Security, Explore, Network section and hit refresh buton to load data into map. But first you need to select Data sources (link above the map, on the right side), include filebeat-* index pattern.
With such configuration you should be able to see geo points representing client locations.
In case you also enable Packetbeat, you will see also networking information data below the map.
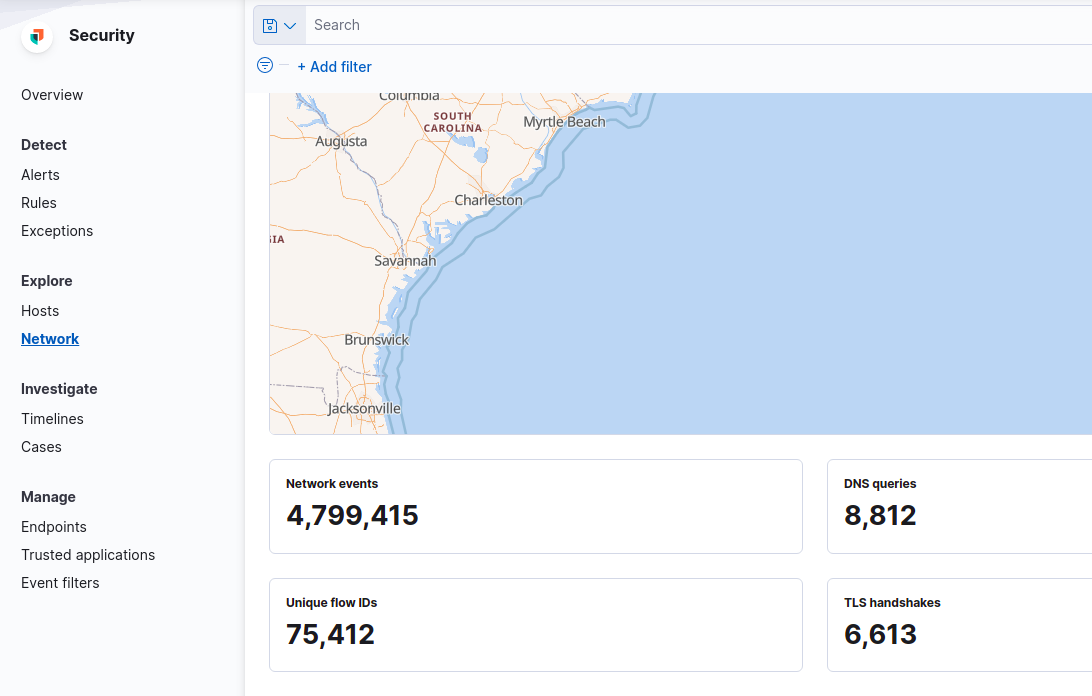
Please remember that enabling Packetbeat generates tons of data in complex environments, so be sure to allocate enough space for these indices.
Summary
This guide covers the basic path for installting Elasticsearch, Kibana, Beats and configuring HAProxy and NGINX to deliver traffic, logs to Elasticsearch and be able to visualize traffic as geo location points.