I installed realtek-re-kmod-198.00_3 package. It was few months ago, but I am pretty sure that is was from pkg and not by downloading it from some repository manually. Finally add to /boot/loader.conf:
Instead of using dedicated Hetzner servers you can use their cloud solutions for less demanding use case scenarios. The idea is to have one server for pfSense and the other one for regular private use, hidden behind gateway. It will be little bit cheaper than renting dedicated server as CX22 costs around 3 – 4 Euro per month comparing to 50 Euro at least for dedicated server. You can have up to 10 virtual cloud server in a price of single dedicated server. Choose cloud for “simple” (or rather straightforward) solutions, dedicated servers for much complicated setups with much more demand for CPU and RAM usage.
Asssuming you use locally Ubuntu 22 or 24.
Initial setup
First install brew. In case of missing python packages, install it with system packages with python- prefix.
hcloud server attach-to-network router --network nat-network --ip 10.0.0.2
hcloud server attach-to-network private-client --network nat-network
Now important thing. In order to route private network traffic you need to add special 0.0.0.0/0 route to gateway. Now it seems that it can be only done using hcloud as web UI do not allow it:
This is second thing which is little complicated if you want to do it via web UI. It is highly recommended to do this via hcloud. Download pfSense packge, decompress it and pass ISO image as parameter:
hcloud server attach-iso router pfSense-CE-2.7.2-RELEASE-amd64.iso
hcloud server reset router
Now do regular pfSense installation and detach ISO:
hcloud server detach-iso router
hcloud server reset router
After rebooting pfSense:
configure WAN as vtnet0
configure LAN as vtnet1
uncheck Block bogon networks
set LAN as DHCP
set LAN System – Routing – Static routes from 10.0.0.0/16 to 10.0.0.1
disable hardware checksum offload in System – Advanced – Networking
set NAT outbound to hybrid mode
set WAN NAT outbound from 10.0.0.0/16 to any addressing WAN address
change LAN firewall catch all rule as from any instead of LAN subnets
Routing traffic
Once you have your pfSense router setup you need to pass traffic from private-client server to 10.0.0.1, which is Hetzner’s default gateway in every private network. We defined earlier that we want to pass all traffic via router (10.0.0.2), but it will be done in Hetzner router which will pass traffic from private-client to router and then to final destination. So we do not pass traffic directly to pfSense gateway n such configuration.
It is important to uncheck blocking bogon networks as our router will be passing private traffic in WAN interface. Setting WAN NAT outbonud is also critical in order to have this routing working. Finally, pfSense adds default LAN catch all rule, which needs to be modifyed to apply all sources and not only LAN, which allows routing traffic via Hetzner gateway.
Beforementioned aspects are outside of regular pfSense configuration as in dedicated servers, because here we have private managed network which runs with different rules, so you need to follow those rule if you want to have pfSense acting as gateway.
Afterwords
Be sure of course to setup you own desired network addressing and naming conventions. If something is unclear, refer to official Hetzner documentation which can found here. After configuring private-client you can disable public networking. Switch it off and then unlink public IP address and power if on again. Now to access private-client either use Hetzner Cloud console or setup OpenVPN in your fresh pfSense installation.
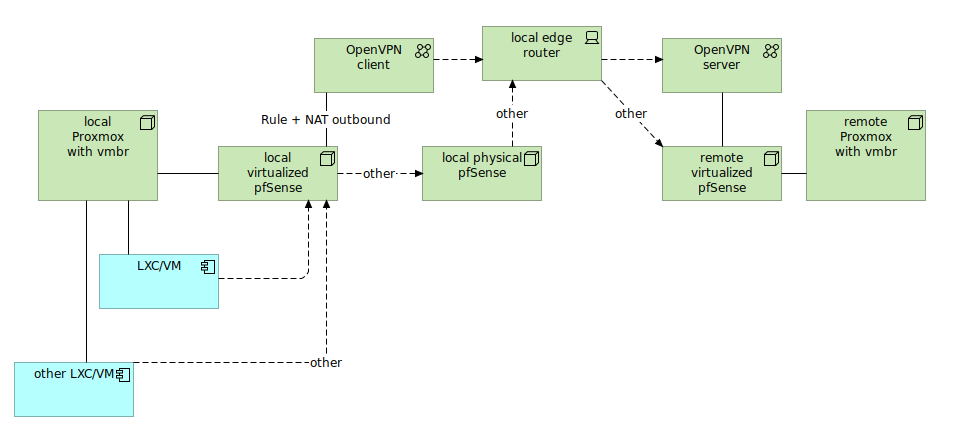
Lets say you want to pass traffic from your local container/VM via some external pfSense box. This way there is no need to setup VPN on each container you want to include in the setup. There is OpenVPN option to pass all traffic thru the tunnel, but it breaks several other things both locally and on remote pfSense box.
So there is this network configuration:
Local virtualizated pfSense purpose is to pass-thru traffic. So it has only one interface which is WAN. No LAN interface over there. Addressing can be the same as on local physical pfSense.
You need to first setup OpenVPN client (CA, certificate, user and connection) and then create interface assignment upon this connection. It will called something like ovpncX. Remember that OpenVPN is restricted name so you need to call your interface with other name.
To differentiate traffic from LXC/VM create pass rule with source set at this LXC/VM and in advanced settings point OpenVPN client gateway. Remember to put this rule before any other catch-all rules. Once you got OpenVPN client and pass rule, go to NAT outbound and set manual outbound NAT to enter rule manually. Use LXC/VM address as source and select OpenVPN client interface.
To differentiate traffic from other LXC/VM not to pass traffic thru OpenVPN client, add another NAT outbound (no need to set pass rule here as we use default gateway) and set WAN interface and other LXC/VM address as source.
Now you would have one LXC/VM passing traffic thru remote OpenVPN (via OpenVPN client) and the other LXC/VM passiing traffic regularly thru WAN into secondary physical pfSense and then into the internet. This way you can manage how to expose your traffic to public internet.
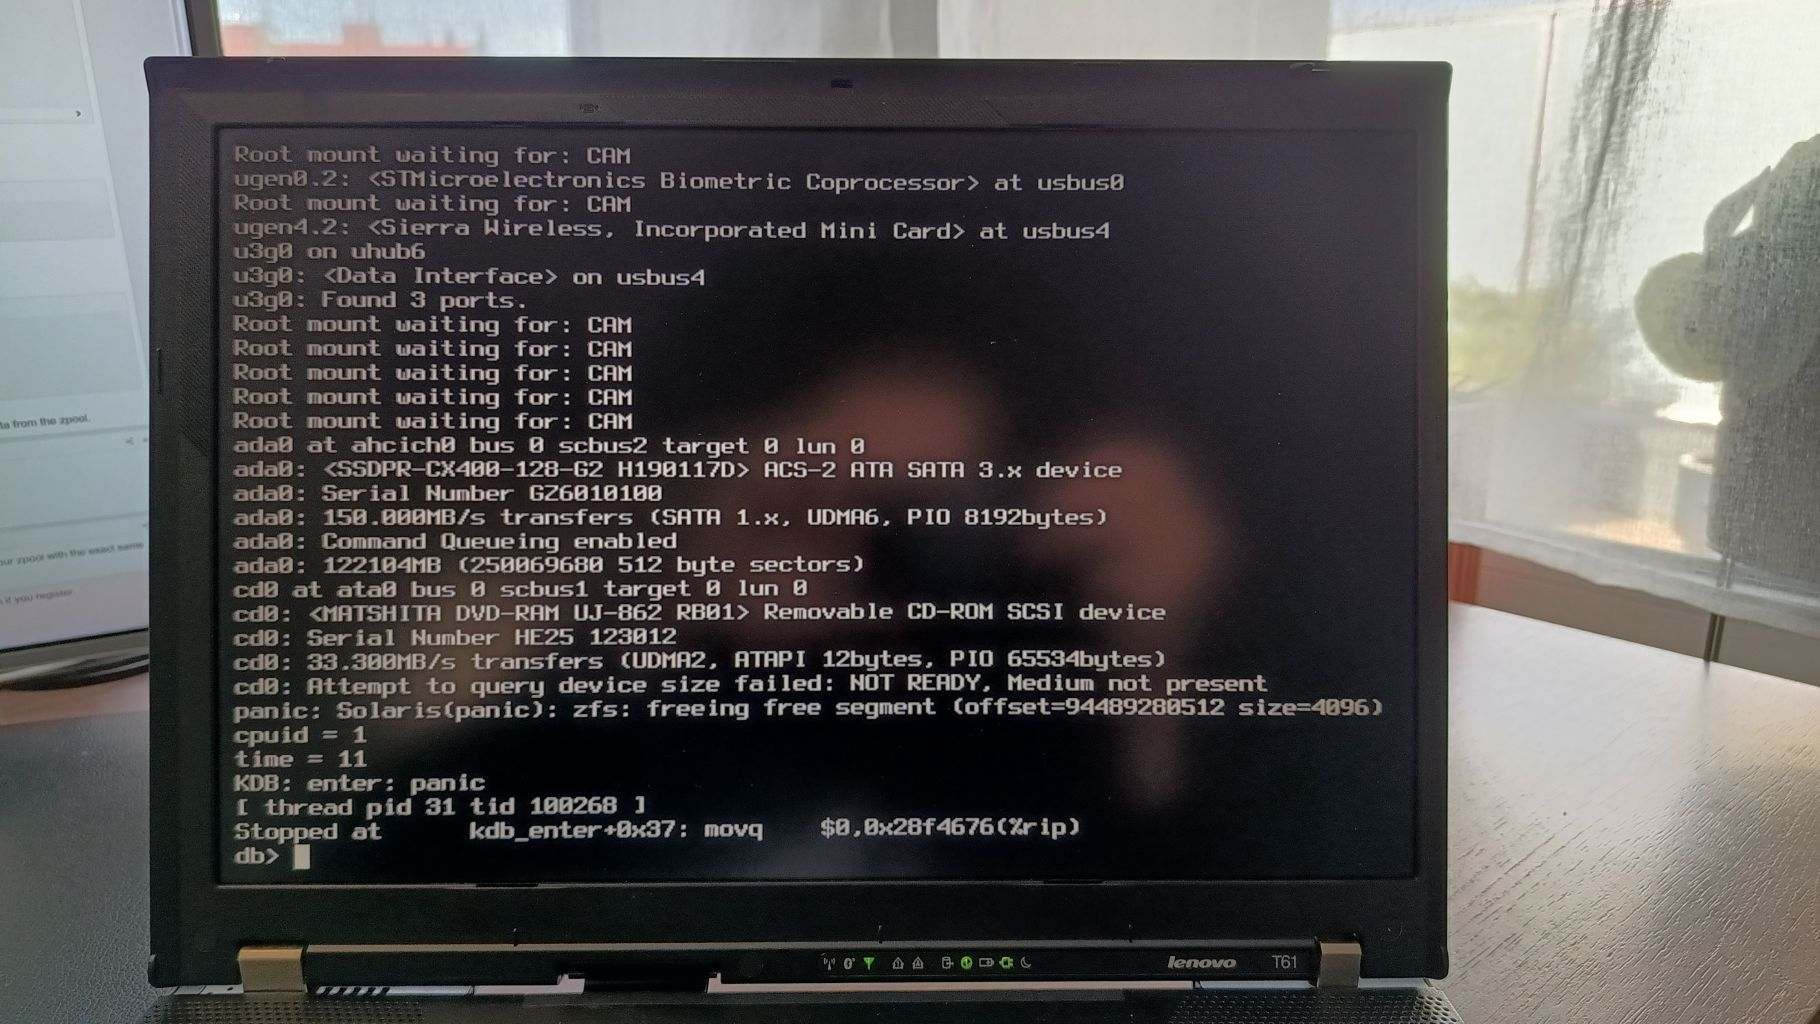
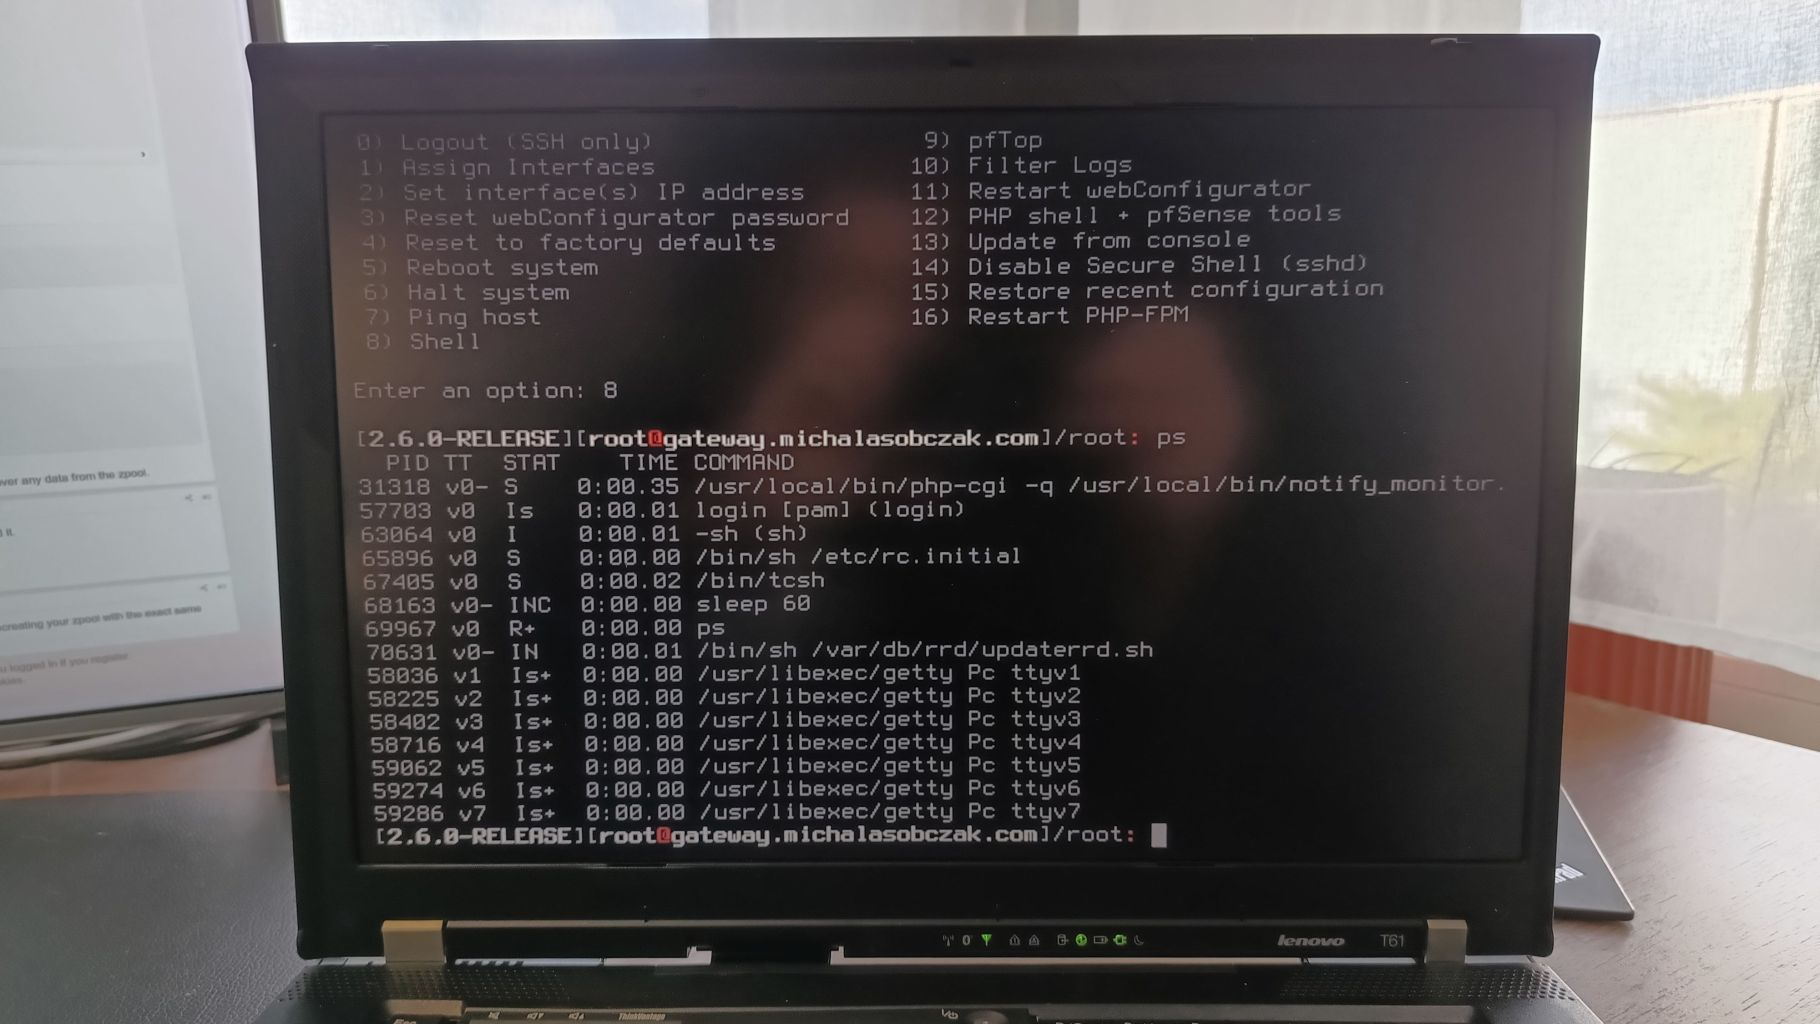
Recently my pfSense running on the same hardware for almost 3 years, died. I tried rebooting it and removing RAM, cards etc, with no luck. So decided to bring it back from configuration backup onto new drive. But after few days I stared investigating this matter and I got some temporary solution to start it back.
Here is how kernel panic looks like. It says: “Attempt to query device size failed” and “zfs: freeing free segment”. The latter is the cause of the problem with system starting up.
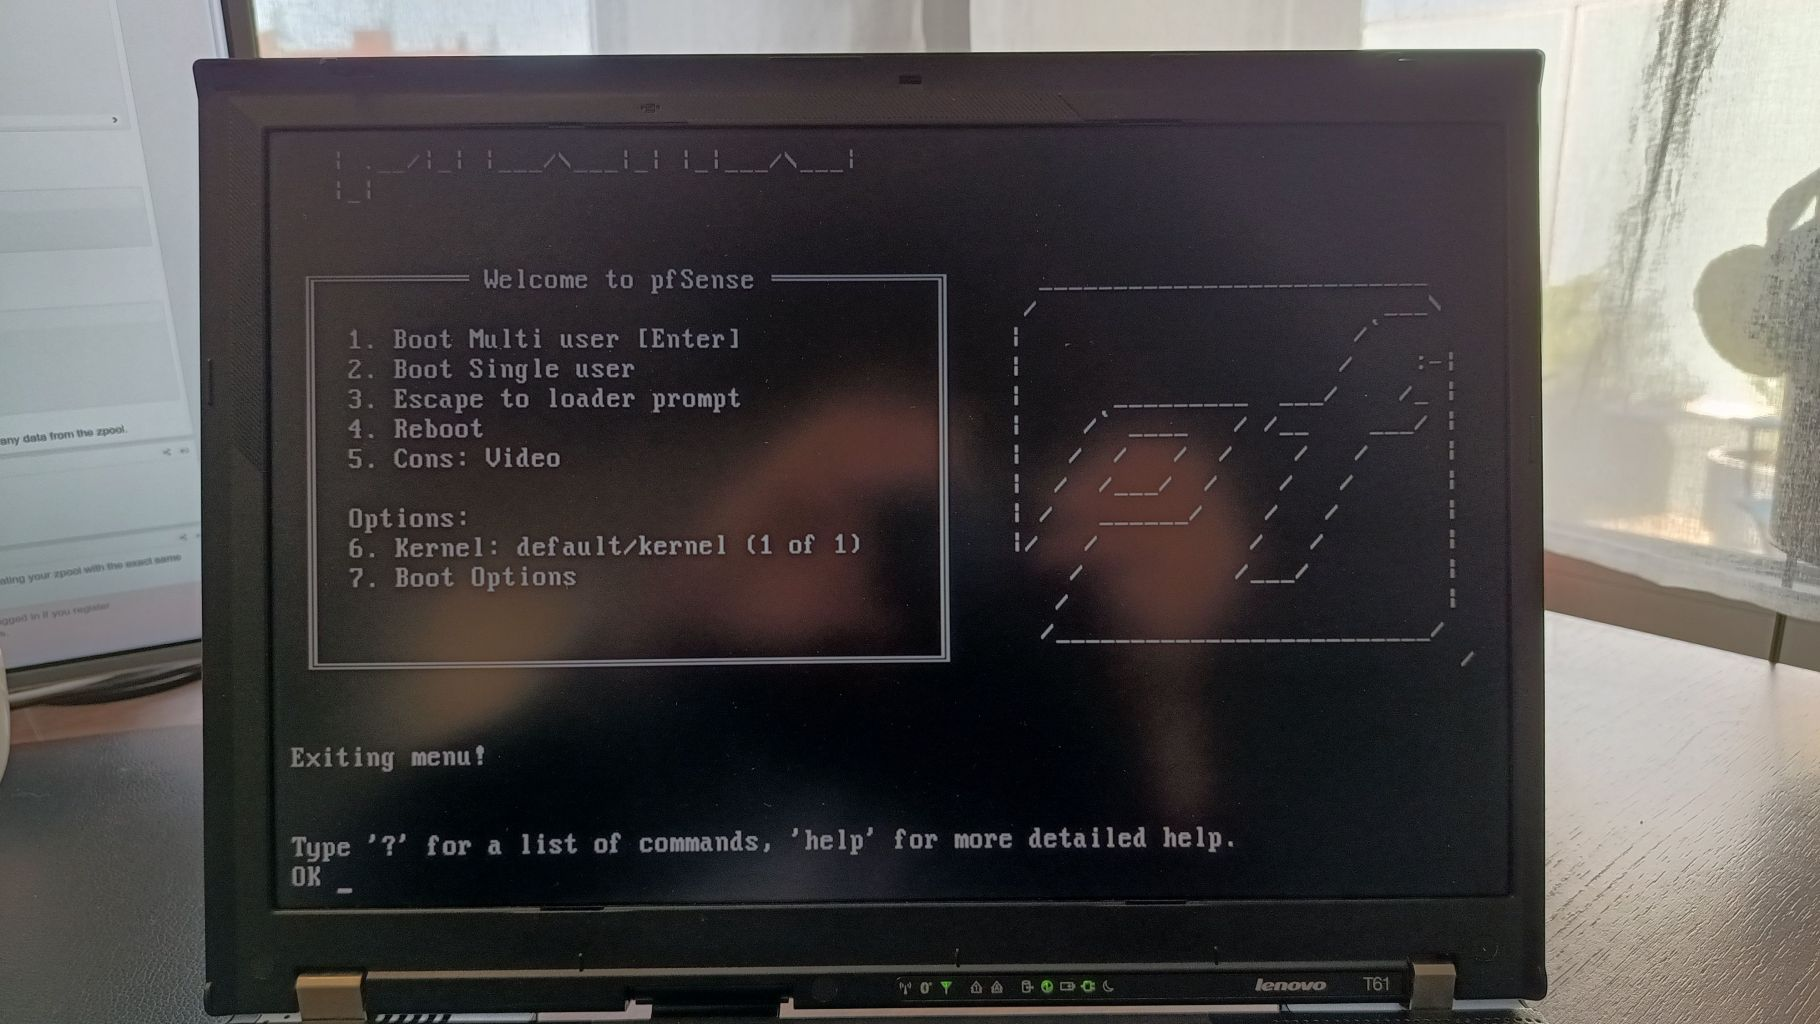
First, select “3” to escape to loader prompt:
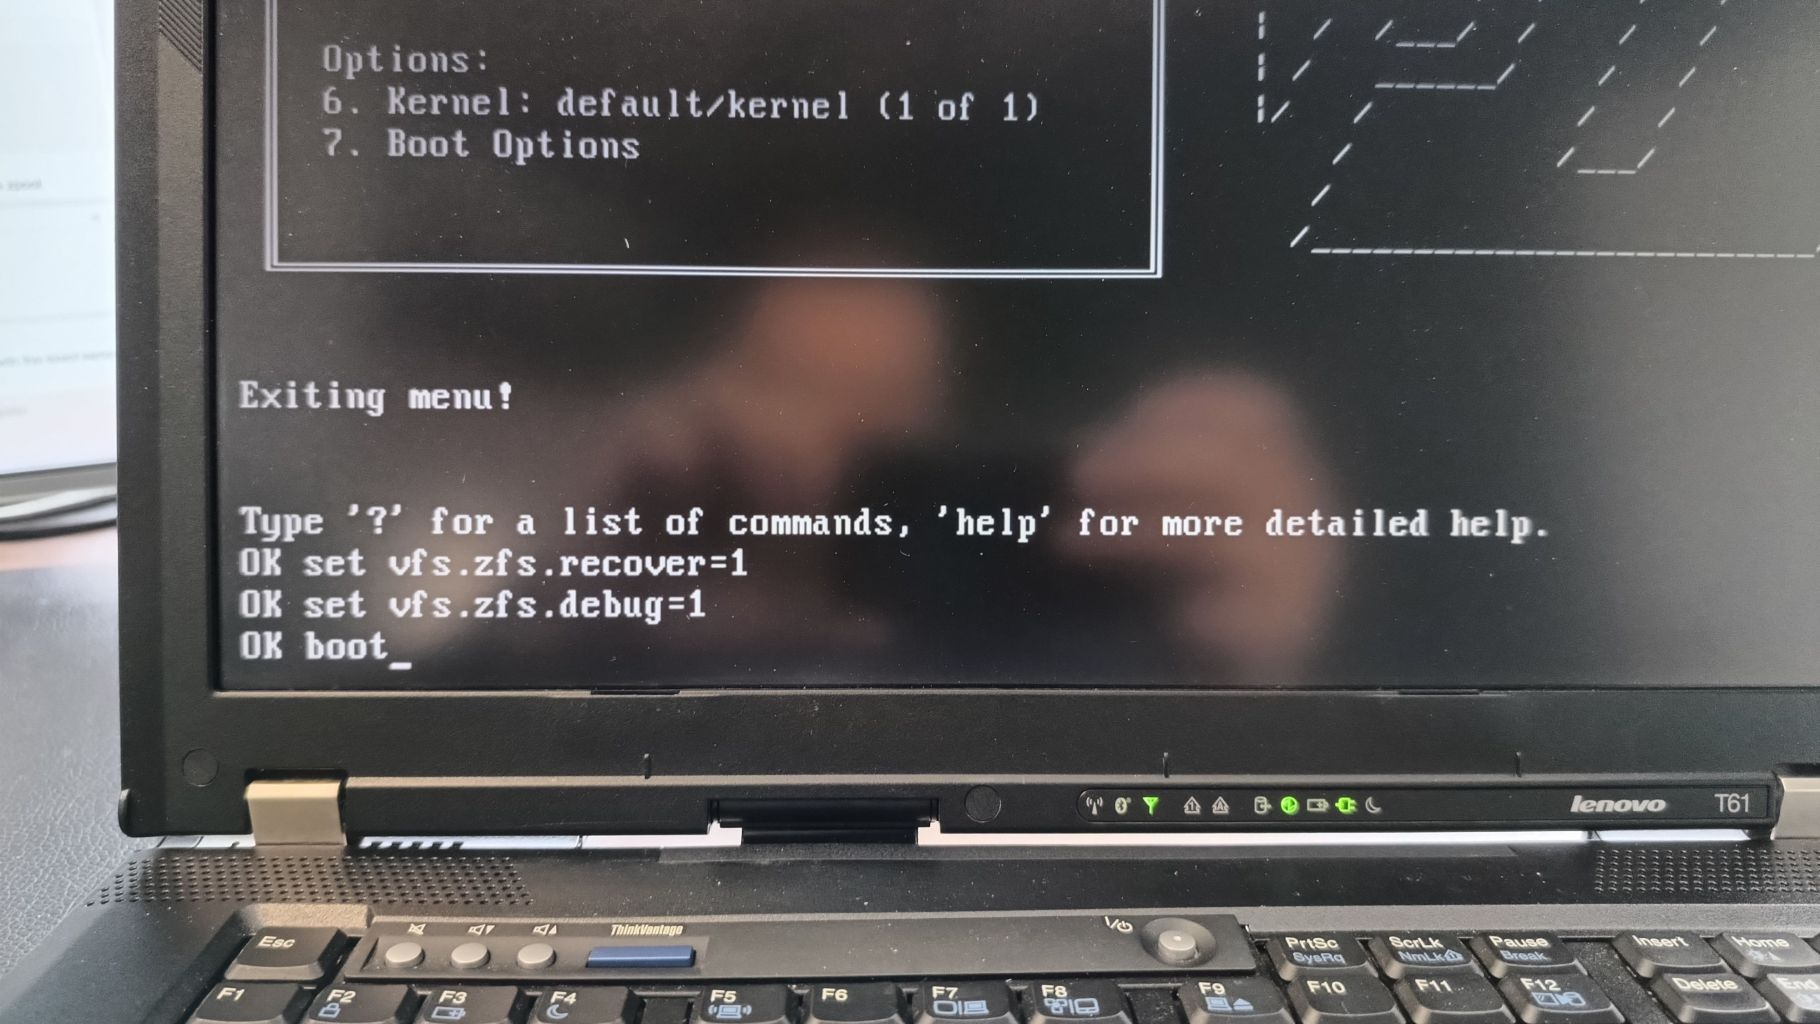
Then set:
vfs.zfs.recover=1
vfs.zfs.debug=1
boot
And you are in. However, now you need to verify if data is present, not corrupted and finally fix ZFS pool/sets as it is only a temporary fix and most probably still requires some manual work to be done.
Create secure, high-performance, affordable environment for your container applications using Hetzner dedicated servers. For around 50€ per month.
This setup can also be done using different server providers, both dedicated and shared, even on public cloud. This tutorial has not been sponsored by Hetzner or any other software vendors. If you are interested in similar setup, please drop me a message via Linkedin.
Goal
The goal for this setup is to run Docker container in Swarm mode in secure and reliable environment. For sake of security we enable Proxmox firewall, pfSense firewall and Suricata IDS/IPS. For sake of reliability we configure md RAID and create 3 different combined backups targets. To turn this setup into production one, just add two or more Proxmox nodes and two or more Swarm nodes. You will be good to go with your online business.
Hetzner dedicated servers
00:10: Start with visiting Hetzner portal called Robot. It is for managing dedicated servers. We can either rent brand new server with the latest hardware available or go to server auction for a little bit older hardware but for better prices. For this test I will pick server from auction with at least 3 drives inside and 64 GB or memory. Both for test and production setups I suggest picking up enterprise grade CPU like Xeons which tend to better on long term basis and are much most stable than desktop grade CPUs.
Once ordered you will have to wait for your order completion which should take 15 to 30 minutes for most the times, but in case of custom setup you will have to wait even 5 working days, so be sure to order with enough notice period. Your orders will be shown in Server section where you can inspect the server, send remote reboot or order serial console in case of some troubles. Next you give your server a name and add it to virtual switch called vSwitch. It will enable your server for communication with your other servers binded to the same vSwitch ID. Important thing that the MTU must be 1400. For our test setup I also order additional public IP. You need to write usage explanation as IP4 pool is limited. This additional public IP will be used for pfSense router/firewall which will handle all the operations traffic.
Proxmox virtualization
01:52: After the order is completed you receive root user password over email, so be sure to change it at your earliest convenience. I SSH into the server where you can see brief overview of what is inside, what kind of CPU and drives we have and that type of ethernet adapter is installed. System installation can be run using installimage utility. Few things important here, SWRAID, SWRAIDLEVEL, HOSTNAME and partitions setup. Be sure to install only on 2 same size drives and leave other unconfigured. Software mirror, similar to RAID will be handled by md. Be sure not to install system on spinning drives as there will be significant bottleneck in terms of IO available which will be noticeable.
After Debian installation is completed, reboot the server and wait until it is back again. If server is not coming back, then restart it from Robot panel. SSH once again and start installation of Proxmox using my step-by-step tutorial. It covers system update, adding required repositories and installation or Proxmox packages and services. Speed of this process depends on our hardware specification, especially drives on which the system is installed on. It is worth pointing out that Proxmox uses custom Linux kernel and it is suggested to remove other ones.
Having Proxmox installation completed, it is time for disable RPC bind services enabled by default, running on port 111. It is required to have it off from the network if you are in German internet as it is a government requirement. Since we do not need this in test setup we are good to go further with network configuration. If we use only public network and vSwitch then we need to have a bridge, public IP routing and VLAN section. If we would use additional local LAN or VLAN or use separate physical and dedicated switch then there will be need to add additional sections here. Be sure to double or even triple check you configuration, after network reload it have to work. Otherwise you need to opt for remote serial console which takes sometimes even up to an hour. I personally prefer having a consistent naming scheme for server, VLANs and subnets as you may notice. Remember to include 1400 MTU in VLAN section. After networking service restart check local and external connectivity.
As an interesting pick we try to import Proxmox CA into browser certificates store in order to have SSL padlock clean without any security warnings. As for this, we need to have certificate common name set in /etc/hosts to have running. Later on we are going to configure HAProxy over OpenVPN.
The first configuration we will conduct it is a firewall configuration. I put VLAN, LAN and public IP4 addresses in Datacenter-Firewall section which will be applied on all nodes in Proxmox cluster. Of course if we will add additional nodes. Datacenter configuration is then much easier to manage. Firewall will be enable only after going into Firewall-Options and marking it as enabled. Remember to add yourself’s public IP4 address not to cut out the connection.
pfSense firewall/router
11:54: For handling public traffic I install pfSense router/firewall which can be also extended with additional packages providing wide range of features, like VPN, IDS/IPS appliance etc. We start with uploading pfSense 2.7 CE, which will also require us to do an upgrade. Before continuing I review drives condition using SMART interface. And quickly initialize third drive as a directory, need for future PBS installation. I also upload PBS ISO image as well as Ubuntu ISO image.
Create new VM with basic settings. It is important to have at least one network adapter. The first one will be for WAN interface and second one for VLAN where we set MTU 1400. On WAN we set virtual MAC address created earlier in Robot portal. It is critical to have it on WAN if running VM on the server. Missing this setting will cause MAC bleeding warning from Hetzner and even server lock. pfSense installation is straightforward. We pick all default settings. Since we use md for drive mirroring there is no need to configure this redundancy for pfSense. After reboot, pfSense asks for network configuration, both for LAN and WAN interfaces. Need to adjust it. At first, UI is accessible over WAN as we do not have option to go into LAN/VLAN. You could setup sandbox VM from where you could access local network, but for this test setup we will continue with WAN until OpenVPN will be configured. After any major pfSense configuration change it is good practice to reboot it.
Using WAN without Rules setup means that you have to do pfctl -d to disable firewall. Login using default credentials and go thru UI step-by-step configuration. You can change DHCP WAN settings and put explicitly WAN default gateway as it seems not to be set.
pfSense dashboard, which is main page can be enhanced with few fancy graphs concerning service and network statistics. Main configuration can be done in System – General Setup or Advanced settings. We setup domain, timezone and DNS configuration. For later HAProxy you need to disable auto WebGUI port redirect, even having it on different port than standard one, which is a good practice both for UI and OpenVPN services running on the box.
For OpenVPN use we need to create CA certificate to be ble to sign server certificate. Then create certificate. Next create OpenVPN server port pass rule. Then go to Services-OpenVPN and add new OpenVPN server with SSL/TLS + User Auth configuration on TCP IP4 only. Be sure to point server certificate, it is easy to miss that or select even some user certificate. Set tunnel network addressing for clients endpoints as well as local network which will be routed to the environment. It is good to have consistency for tunnel subnet numbering and also have set concurrent connections to some lower value to quickly identify possible misuse.
To use OpenVPN you will need a user with a user’s certificate. First create user and then create it’s user certificate. Now comes the quirky part, which is installing pfSense additional packages on outdated base system. There is an error message which leads us to System-Update setting. By trial-and-error I know that it is necessary to update system first, but it varies from version to version. This time neither UI upgrade nor console upgrade worked for me. Solution was to rehash certificates. On various previous versions there have been other solutions to similar compatibility issues. No doing it right could brick the system, so be sure to have backup before starting such troubleshooting session.
Finally after rehashing certificates we can proceed with upgrade. Without upgrade packages were not available. This upgrade process takes few minutes.
How to import OpenVPN user configuration into Ubuntu? Either by using GUI or nmcli utility. I find the latter easier and more stable across various previous Ubuntu versions. Even with imported configuration you still need to provide username, password and select Use this connection only for resources on its network. To use connections over OpenVPN interface we need to add appropriate passing rules. If you want to diagnose connectivity with ping then be sure to pass ICMP traffic as well. Check if OpenVPN client is connected, if you already created ICMP rule, and in case it still does not work, then reboot to shorten configuration apply time.
HAProxy
19:10: Proxmox server access can be achieved using HAProxy. First we define backend which is target server at port 8006. As we do not have options to load balance it at the moment it’s better to disable health checks. Secondly we define frontend at some custom port on LAN interface with TCP runtime type and backend set to what we have configured a moment ago. In settings we need to enable HAProxy, define maximum connections, set internal stats ports and lastly set max size of SSL DH parameter.
It’s good to clean up unused firewall rule.
We choose port 9443 for Proxmox UI and from now we need not to use public WAN interface to access it as there is tunneled OpenVPN connection available. Why do we even need to set HAProxy for Proxmox UI? Because Proxmox does not route itself thru pfSense which offers OpenVPN, there is need to access it either WAN, NAT-proxy or what we have just made which is HAProxy configuration.
Now, since we have a secured Proxmox UI connection, it’s time for setting up 2FA with TOTP. Some caveats concerning this one, if you want to create cluster and then add additional server to it (it must be empty, without VM/containers), then you need to disable it, add server to cluster and then enable it once again. Moreover most probably you would need to restart pvestatd service as it gets out of sync most of the time.
Suricata IDS/IPS security appliance
21:03: Interfaces list is empty on start, so need to create one, particularly for WAN interface. What is important here is to enable Block Offenders in Legacy model, blocking source IP. As for sensitivity of detect-engine I prefer setting either as Medium or High. In terms of rules and its categories there are two approaches. The first one tell that you should disable technical rules for flows etc, which will for sure decrease amount of false-positive blocks. However, by doing this we will welcome much more invalid traffic. So, there it is a second approach, where we leave this enabled and take care of false-positive blocks manually. I recommend enabling almost all of EP Open Rules categories. The most important thing here is to enter emerging-scan rules set and enable all nmap scan types as they are disabled by default for some unknown to me reason. This way we will be able to block the most popular scans. Same thing with emerging-icmp rules set.
To be able to comply with various security policies and standards it’s good to know that there is possibility to enlongen logs retention period for lets say 3 months. We can also send logs to remove syslog both configured from Suricata directly or in general pfSense settings also. At this point, we can enable, start Suricata, running on our WAN interface. On alerts tab we can monitor security notifications and also unblock source IP addresses here directly. On blocks tab, there is list of all currently blocked IP addresses, from where we can unblock them or see if this happen already in the past as there is a list of previous incidents.
It did not even take a minute a get some incidents on the list. One is from technical set of rules, like TCP packets validity verification and two others are from scan and spamhouse rules set from ET. This means that we have been both scanned and communicated from entity enlisted in Spamhaus directory, group 9 to be clear. Running Suricata on few dozens boxes for few months will give us millions of numerous alerts and blocks. Sometimes source IP addresses will be repeated between different locations meaning that either someone scans whole IPv4 blocks, target ISP or target exactly you as a person or organization running this boxes. On the alerts tab you can lookup reverse DNS for IP addresses as well as try to geo-locate them. It may or may not be useful information, depending on your needs to forensics analysis in your business case.
When interconnecting systems, either thru public interface or VPN tunnel it is common thing that system will cross-diagnose itself and put blocks. To avoid such a situation there is pass list tab, where you can enlist your systems public IP addresses to prevent from blocking. Once you have created some pass list containing external public IP addresses you can bind it to interface on interface edit page.
Ubuntu VM
24:44: Little overview, we purchased, rented a dedicated server, installed Debian, Proxmox, pfSense, HAProxy and now we face with creating Ubuntu VM which will later on hold a Docker Swarm master/worker node handled by Portainer CE orchestration utility. Creating new VM is straightforward as we go with basics. However concerning a Ubuntu server installation there are few options. First of all we can use HashiCorp Packer or even Terraform, as there is some provider for Proxmox 7. Moreover instead of manually create installable image we could create autoinstall or cloud-init configuration which will do it automatically. For the purpose of this video I will go manually. It’s important that every system drive at any provider including your home, should be secured by an encryption service such as LUKS. On this topic you can find some article on my blog. For the ease of use I prefer to manually enter LUKS password for decrypting drive. There are other options as well but require additional software or hardware.
After base system extraction and installation, there are some additional packages to be installed and updated fetched and apply also. It will take a few moments depending on the hardware of your choice.
Now the system installation is completed and we can eject ISO image and hit reboot an test LUKS decryption for the system drive.
Docker Swarm + Portainer
26:55: This section starts with Docker-CE service and tools installation as it is a vital part of Docker Swarm setup with Portainer used to orchestrate containers. When I look for some verified and well tested setup tutorials I often visit DigitalOcean website, which is great cloud computing provider I use for over a decade once I switched to it from Rackspace. Within that time around 2010s these companies have been starting well but have been overtaken (in the field of public cloud solutions) by Google, Microsoft and Amazon quite quickly and instead of hard-competing they decided to choose different business approaches to stay on the market.
Once we have installed Docker-CE service we can continue with initializing Docker Swarm. But before we can do it, there is need to manually create docker_gwbridge and ingress networks, just before you would run docker swarm init. Why is that you may ask? Well, it’s because Hetzner requires you to run MTU 1400 and Docker actually does not support changing MTU on-the-fly, it does not follow host network settings. With that said you can either leave network as they are, but do not use vSwitch or use host only port mapping which will make binding to host adapter instead of ingress. But in real world case it is good to have possibility to create Docker Swarm with more than one node, at least 3 master modes (uneven number required) and also 3 worker nodes. Such a setup can be spread across few different physical boxes, connected thru vSwitch in Hetzner which runs at 1 Gpbs at its maximum. Even if you do not plan to use similar setup it’s good to have MTU set to proper value because you would be struggling with services migrations after Docker Swarm it’s initialized and in production use.
Now regarding Portainer CE which is a UI for managing Docker containers, Swarm setups and many many. There is business edition with even more features available. Highly recommend it, especially if you look for smart and simple solutions for your containers and struggle with OpenShift/OKD/Kubernetes. I have commercial experience with all of them so I can tell you that there are some things that the duo Docker Swarm and Portainer lack, but those lacking things can be easily replaced with some other solutions. In case of the installation, you just download YML file with configuration of containers and so. As those things which are UI and agent will run within custom network, there is also a need to adjust MTU in this configuration file, before deploying.
It takes about a minute to download images and run them in Docker. UI is available on port 9443. Initially you create user with password and you are in. The primary environment is the local one and as Portainer runs with local volume it should stay on this particular node. Agent however is deployed with global parameter, which means that it will be deployed on every node in the Docker Swarm cluster which is available.
Now it is time for hello world container on our newly installed virtualization and containers environment. There are two types of testing images. First one is to check if anythings works at all and its called hello-world. It checks if Docker can pull images from the internet or other network and if container spawning works. As it does not have any hanging task, it will cycle after each and every run. So it is good to test with something more useful, as nginx for instance.
Nginx is a HTTP server, so it’s now worth setting up a port mapping which will utilize a internal Docker Swarm network called ingress. It take few seconds to download image and run it. We can check already in browser at the port of our choice if the service is actually running. And it is. However it is a local network connection accessible only over OpenVPN tunnel. To make this Nginx server accessible from the public internet we can use HAProxy. For low to mid traffic which is up to 20 thousand concurrent user will be fine to use single pfSense HAProxy instance as it’s enough in terms of performance, configuration etc. For bigger deployments I would recommend dynamic DNS such as one available on scaleway.com, multiple pfSense boxes with seperate public IP addresses and separate HAProxy either on pfSense or also separately.
This time, instead of TCP processing type as in case of Proxmox UI, we gonna use http / https (offloading) which would encrypt the traffic which is reverse proxied to backend server with no encryption as we do not provide encryption on nginx side at the moment. What is the benefit of having TLS offloaded onto pfSene box? First of all there is less configuration to manage as we either enter certificate in certificates store or use ACME with LetsEncrypt for instance. Second of all it just separates environment entrypoint from the system internals in the local network.
As we run HAProxy on WAN iterface now, there is need to create firewall rule for all the ports used in our setup. This test setup covers only unencrypted traffic. Encrypted traffic will also require HTTPS pass rule as well as redirect scheme on HAProxy frontends. It is as good practice in pfSense to have rules organized using separators, it makes just everything here much more clear. Be sure to either provide proper health check and have multiple backends or just disable this feature as you have only one backend.
Proxmox Backup Server
33:44: The last topic in our test setup is a backup, which is very important thing aside from functional features of this environment. We start with creating PBS VM with some basic settings. System is a Debian and it requires not so big root partition, but it requires quite a lot a memory which will be even more important if we have slow drives. Remember that encryption of backups happens on client side in Proxmox. PBS installations is straightforward without any quirks. For now we have only one drive which is for system use.
Once installation is done we add additional drive which will be used as a backup storage. Remember to uncheck backup checkbox. We can add drive live while the system is running. The easiest options is to create a directory which will be mounted with either ext4 of xfs filesystem. Depending on the drive size the initialization process will take from a minute up to 15 minutes or so.
In order to add PBS into Proxmox VE you need to go to Datacenter level – Storage and create new entry with PBS integration. Username requires adding @pam. You need to provide also a datastore name which we just created. Finally to authorize our integration you need to grab fingerprint from PBS UI. Once added, PBS integration with datastore will be present in storage section on choosen selected nodes.
To create backup job, go to Datacenter-Backup. You can choose between local backup and PBS backup. First we define what to backup and with what kind of schedule. Very important is to configure client side encryption which can be done editing PBS integration, on Encryption tab. Auto-generate key and secure it buy keeping it safe in at least 2 locations also being encrypted.
First we test backup job running backup directly on local drive which will be a local copy. It should run significantly faster than running thru PBS, so in some cases this could be a way to run backup, when you cannot lag memory or network. Moreover it is one of methods to have separated backups on different mediums. In case of course when you have PBS on separate drive which is the case here. Now we take cross-out first requirement from standard backup and data protection policy – to have separate physical copies.
Going a little bit further with the backup and the standards and policies thing is to create second backup server with also PBS. For sake of test of course we keep in the same location, but in real world case, it will be different physical location, even different Proxmox cluster. The purpose of having it is to do a backup in main PBS and synchronize it to the second PBS server. This way we can achieve various level of backup and data protection. We can differentiate backup retention on master and sync, deciding where to put more is where we have more space to dedicate for backups.
With the second PBS we create everything the same way. First new thing is to add Remote which is our source server from which we will pull backup chunks. Now with remote configured, we go to Sync Jobs tab where we define how often to synchronize and for how long we should keep those synchronized backups. Both for main and secondary backup server it is recommended to configure prune on servers side. Same applied for garbage collection tasks. Remember that GC keeps chunks for further 24 hours even then prune got rid of the backup itself. That’s the way it works, so with this in mind we need to consider proper capacity planning in terms of the number of copies kept.
Now we have backed-up locally, remotely and synchronized those backups to 3 medium. We should be safe for now, of course if sync server would be located outside the server.
Same as for Proxmox, here in PBS we can also configure 2FA TOTP.
Benefit from running your own docker registry is cost and privacy. But in order to use it in various places you need to secure its connection with SSL/TLS certificates. In case you have only ZeroSSL or LE certificates it can be difficult to maintain both you certificate at ACME/HAProxy leve in pfSense and secondary also in docker registry somewhere else.
Fortunately there is solution for that.
Add your docker registry domain to ACME certificate enrollment as usual. Run docker registry without giving it certificate. Instead configure a domain pointing at pfSense, preferably using non-WAN address. Next configure proxy-pass at Nginx level:
Most important part of it is to set X-Forwarded-Proto to https. Now you can use docker registry which runs locally and forget about setting up certificate renewal at registry level itself.
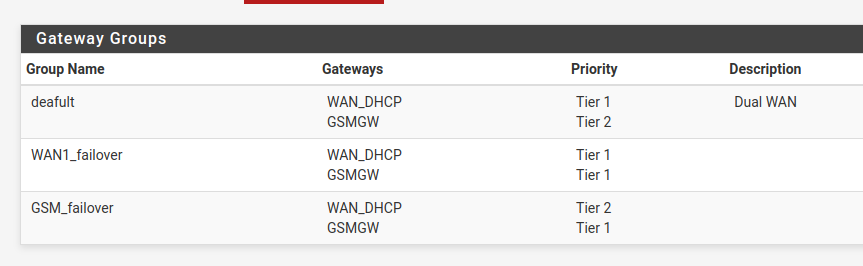
Once in a while there is outage in my main internet connection. In order to keep everything up and running (fortunately) we can setup secondary WAN over LTE connection. Start with connecting your device (e.g. LTE router) over ethernet cable to pfSense box. Then in pfSense itself go to System.Routing.Gateways and a secondary one. Be sure to first activate your secondary interface in Interfaces. You cannot have same monitor IP on both gateways so try to point at well known addresses. Then go to Gateway Groups and configure as follows:
At this point you should have both gateways up and running. You could try to simulate outage either by plugging out cable from the box or selecting “Mark gateway as down” on any of these gateways.
To provide security in a network you can deploy IDS or IPS systems. The difference is on the second letter, D stands for detection and P for prevention. First you start a system in IDS mode and only then you configure it to become IPS system. Enabling Suricata in IPS mode from the start could be confusing. It is advisable to see what’s going on first on a network to be sure not to generate too many false-positive alerts and blocks.
Fig. Traffic diagram
Why IDS/IPS?
You may ask why do I need intrusion detection or prevention system. It is a valid question because you may not want to know what is going on in your network or what malicious traffic is hitting your servers. But if you care about your data especially, then you should have such a system. In certain scenarios it might help lowering bad quality traffic as well.
About pfSense itself
I’m a great fan of pfSense since I think 2017. I’ve been using packet filter before and have been looking for user interface. Fortunately I found pfSense to meet my requirements. It contains firewall and router by default but can be enhanced by various packages like HAProxy, OpenVPN or IPsec.
Suricata installation & configuration in IDS mode
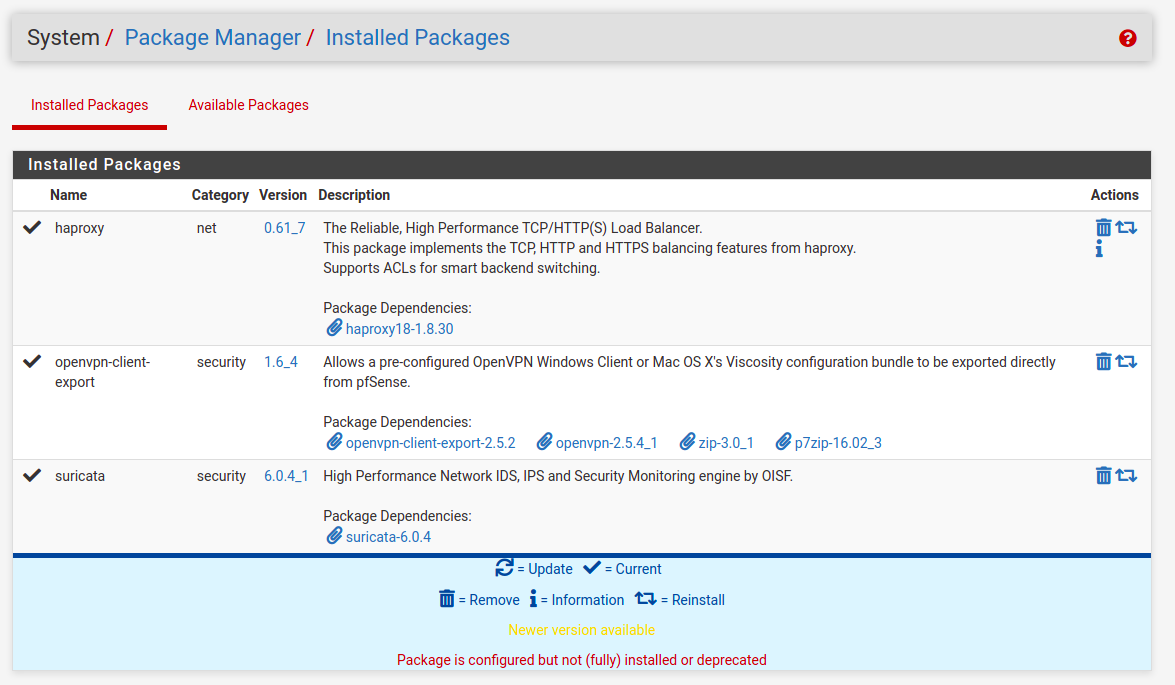
This IDS/IPS system can be installed as a standalone package without pfSense of cource, but it is especially useful when using together with firewall/router installation. The package can be found in pfSense’s package manager under System, Package Manager, Available Packages:
Fig. pfSense Package Manager
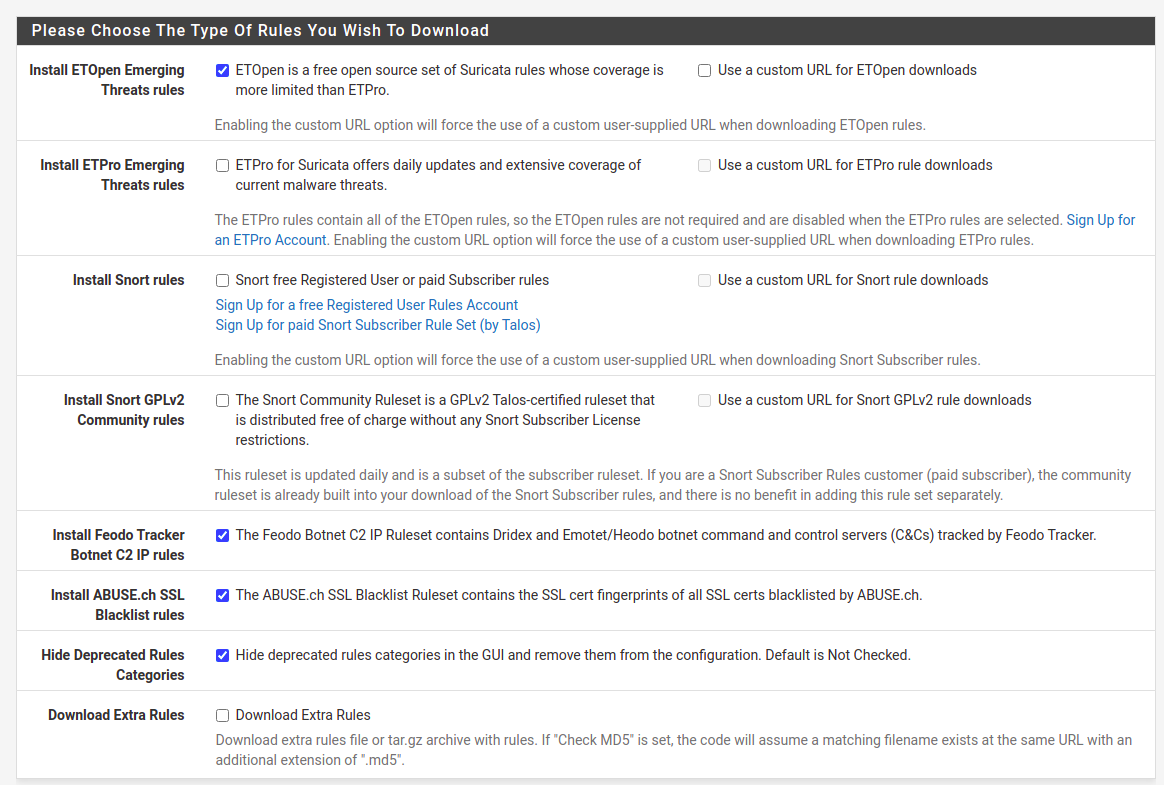
After installation, Suricata configuration page can be found under Services menu. You can with Global Settings first. Check “Install ETOpen Emerging Threats rules“, “Hide Deprecated Rules Categories”.
Fig. Rules download configuration
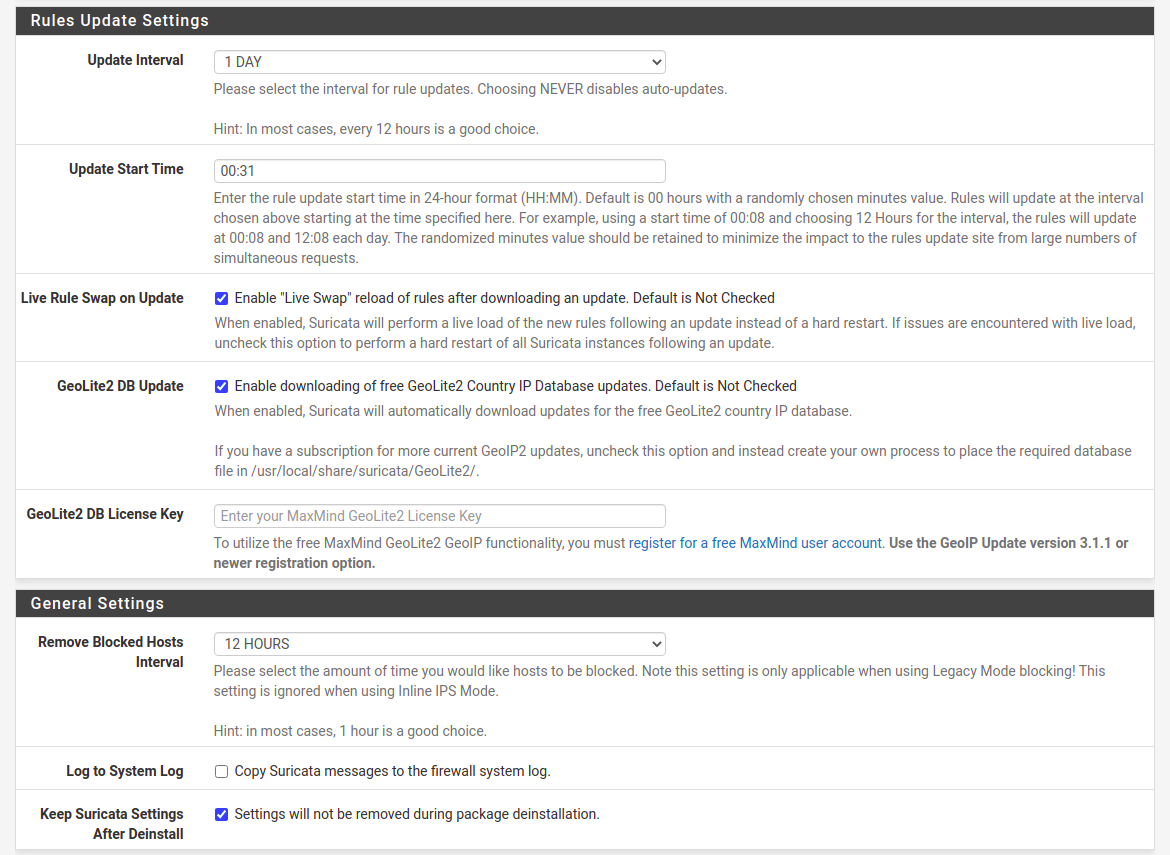
Below, select desired update frequency in “Update Interval” drop-down field. I select “1 DAY”. You can also check “Live Rule Swap on Update”, which will try to reload rules instead of just restart the service.
Fig. Frequencies configuration
For “Remove Blocked Hosts Interval” I select from 6 to 24 hours depending on the system specifics. Even if you will not start in IPS mode, be sure to check this at first configuration. It’s better to do this now instead of remembering to go back here after some time. You may just forget about it.
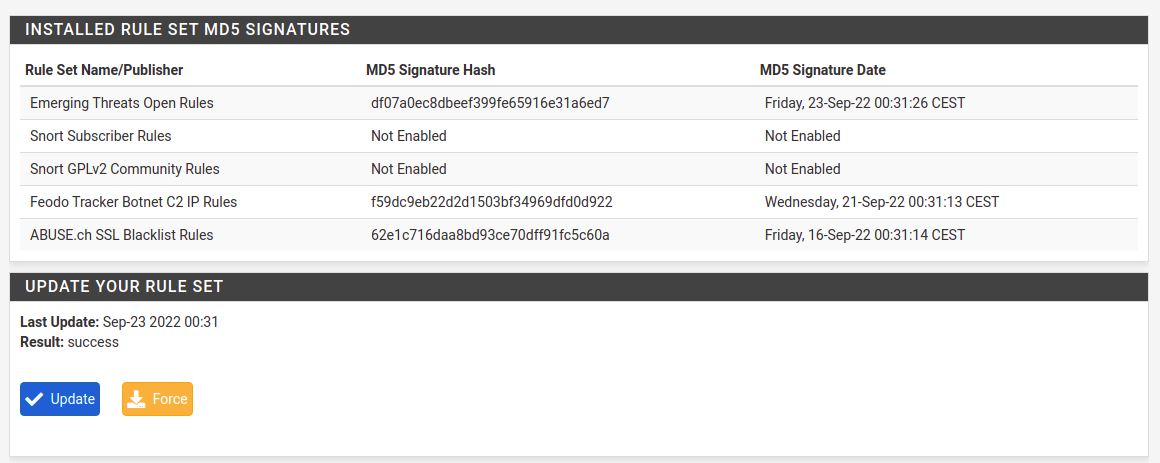
Next you need to force download rules in Updates tab. It does not trigger automatically for most of the time, so at first chance hit the Update button here.
Fig. Downloading rules
In case you have outdated pfSense installation there is high chance that the package will be outdated also and will try to download inexistent rules. It will end up with an error. I will not describe how to upgrade pfSense here, it will be covered in separate article. If rules download works just fine, then you’re fine, if it’s not, then prepare for some additional work.
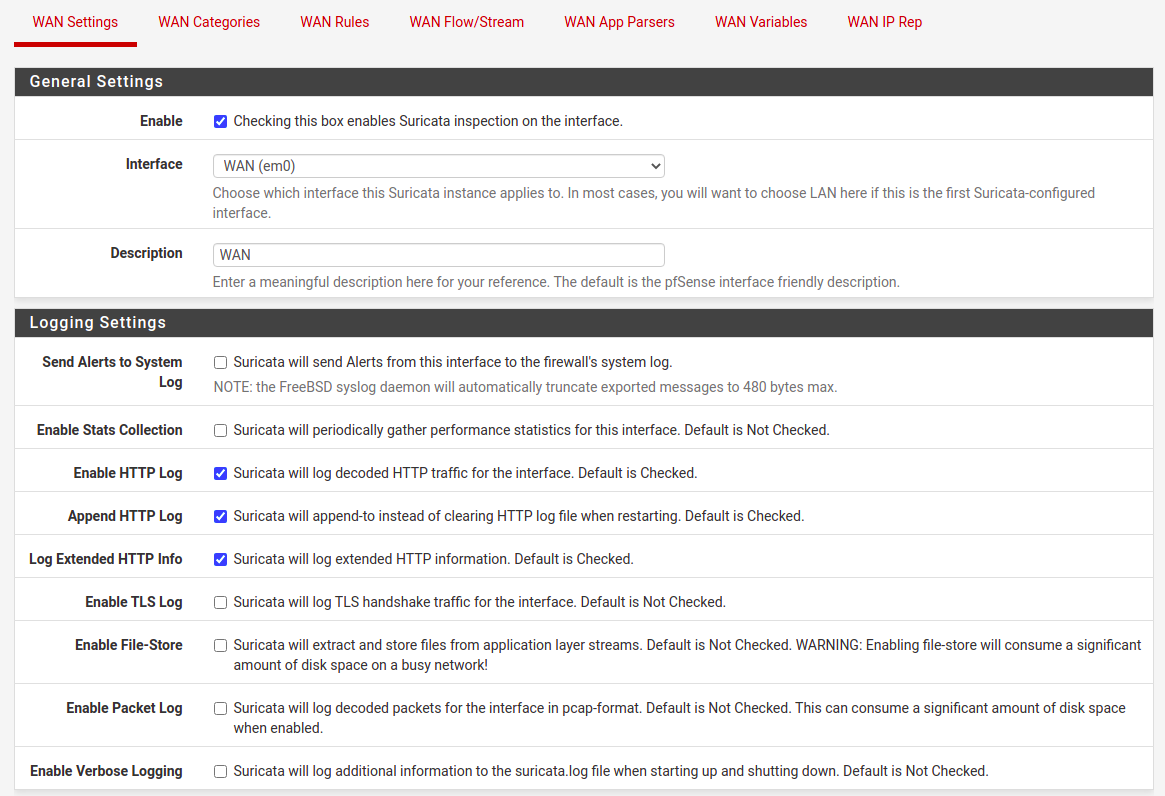
Next thing is to setup interface configuration. For to Interfaces tab and add an interface. There are few things to select there, starting with Enable checkbox if you want Suricata to run on this interface.
Fig. Interface general settings
You can try various options here for TLS, file-store and packet log. Except for TLS, the other onces, does require loads of disk space in a busy network. So remember to allocate enough storage here. There is one more thing in this section to configure, it is “Detect-Engine Profile”, which usually I set to “High” instead of default “Medium”. For now you do not select to block offenders, at first we stay as IDS intead of IPS mode.
For selecting only particular rules categories there is separate article (can be found under this link), so let me skip this one. For testing purposes I suggest enabling “3coresec”, “compromised” and “scan” rules categories. If done then go to Interfaces tab and restart Suricate on this interface. In case it is not starting, go to Logs View tab and browse suricata.log for some debugging information. Most of the time there is an issue with memory size versus configuration at Flow/Stream tab, but this is a subject for different article as well.
Enabling IPS mode
To prepare for prevention mode first go to Alerts tab and browse it for a while. Depending on a scenario you could spend 1 day or even a month just trying to understand what is going on your network/networks. For corporate networks there will be outgoing traffic more interesting that an incoming one. For service providers it is the opposite, so incoming traffic is the one to look after.
It is good to remember, that pfSense Suricata package will add your local network addresses, interfaces addresses and even tunnel subnets to pass list preventing them from blocking. In case you may want to block some internal addresses be sure to check this default pass list or even create your own one.
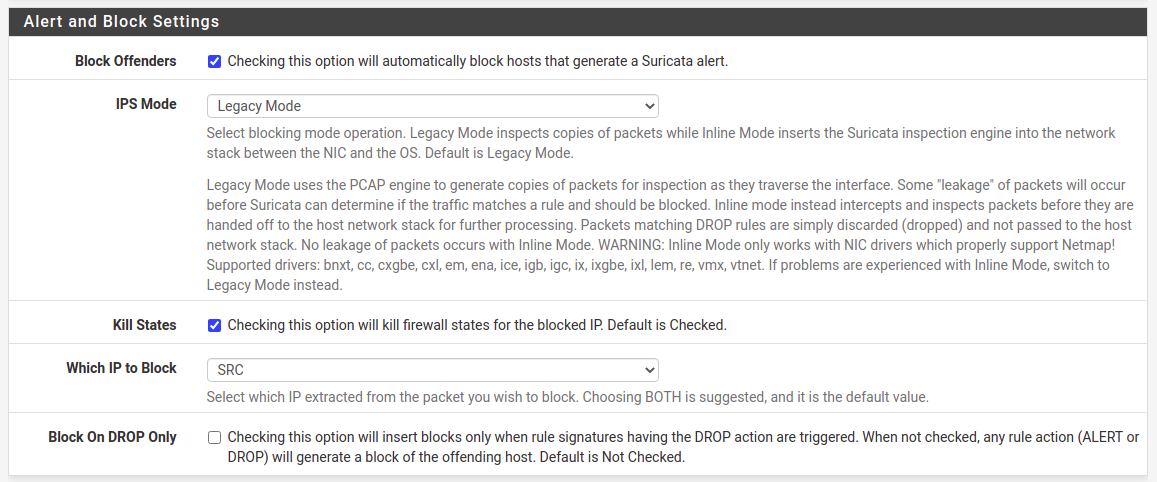
Once you have spent some time investigating what is going on within your network and incoming traffic as well, then it’s time to enable blocking mode. Go to interface settings and check “Block Offenders” option.
Fig. Enabling IPS mode, which blocks offenders
I prefer two things. First one is to select IPS Mode as “Legacy Mode” which copies packets instead of intercepting them between NIC and OS. It’s just simple for starters as there is little additional work to do opposite to “Inline Mode”. Second option I prefer is to block only source addresses, “Which IP to Block” set to “SRC”.
In case for outbound traffic a source address will be a local one, but it will not blocked because it is present on home network pass list. As I mentioned before, configuration depends on the characteristics of your networks you want to monitor. If you have more outgoing traffic then consider blocking target address. For some reason it is recommended to block both source and target, destination addresses. I am not sure exactly why as it clearly does not fit in all the cases.
Threats analysis
After configuration save, restart Suricata service on the interface and wait a while. Public IPv4 addresses are well known, so do not be surprised as within few minutes you will be scanned and explored by some kind of software crawlers. It is applicable even on newly assigned public addresses. For most installations I see from 50 to 500 blocked public addresses within one day of Suricata operating. For home and office networks you are going to see connectivity and updates checking from various devices. For enterprise setups traffic will be different and as it is broad topic it will be covered by another episode. So stay tuned.
Note: for more resilent setup install more than one Elasticsearch server node and enable basic security. For sake of clarity I will skip these two aspects which will be covered by another article.
Now be sure to configure both Elastic and Kibana. For Elastic it is /etc/elasticsearch/elasticsearch.yml configuration file. Be sure to set the following (change 0.0.0.0 with your local IP address):
sudo systemctl enable kibana
sudo service kibana start
Be sure to check if both Elasticsearch and Kibana are up and running with service or systemctl. If everything is fine proceed to setup Filebeat, Packetbeat on client hosts. There is separate guide how to do this. In beats configuration file point to Elasticsearch server you just installed.
HAProxy on pfSense
Example setup includes gateway, which is pfSense with HAProxy package. Configure two frontends, one for HTTP at 80 and one for HTTPS at 443. On HTTP frontend configure
Action http-request redirect
rule: scheme https
On HTTPS configure certificate and check SSL Offloading. Of course you need to load this certificate in System, Cert. Manager. Configure your backends and select it on HTTPS frontend. Now, go to HTTPS frontend and check the following:
Use "forwardfor" option
It is required to be able to read client IP in backend NGINX.
Filebeat on client host
On client hosts install filebeat package. There is separate guide for this one. Edit configuration file, which is /etc/filebeat/filebeat.yml:
filebeat.inputs:
  enabled: false
And then setup and enable NGINX module:
filebeat setup
filebeat modules enable nginx
Now, you are good to go with delivering log files, but first you need to point them in the configuration at /etc/filebeat/modules.d/nginx.yml:
You can use it in application configuration file at /etc/nginx/conf.d/app.conf in the server stanza:
access_log /var/log/nginx/app.log mydefault;
Restart your NGINX server and go to Kibana to explore your data. You need to add this log format, in order to handle client IP which is present in $http_x_forwarded_for variable. This format as close as possible to the default one.
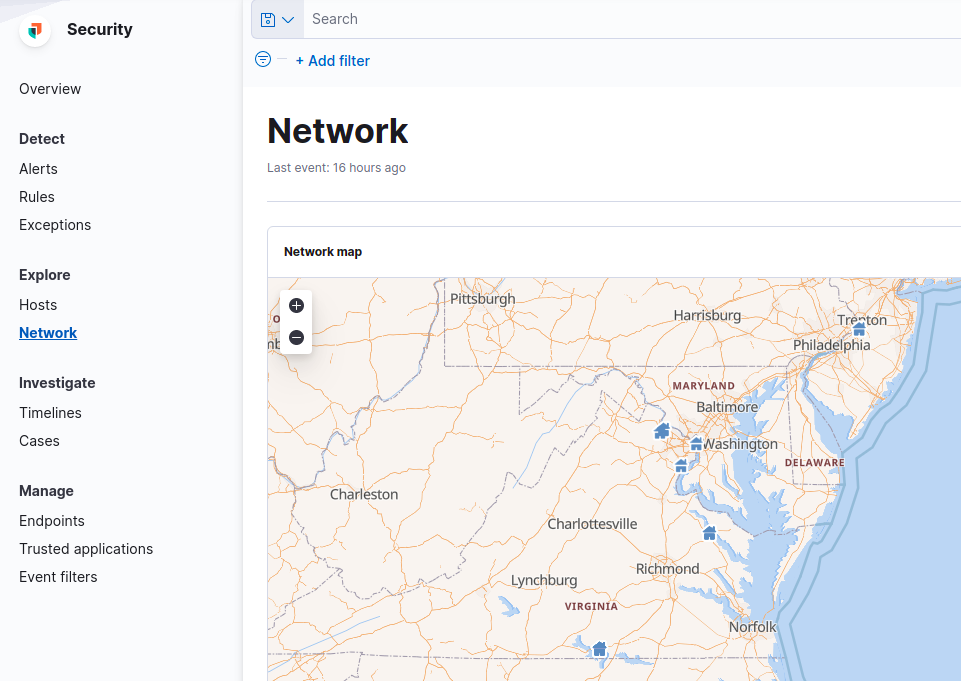
Network geo location map
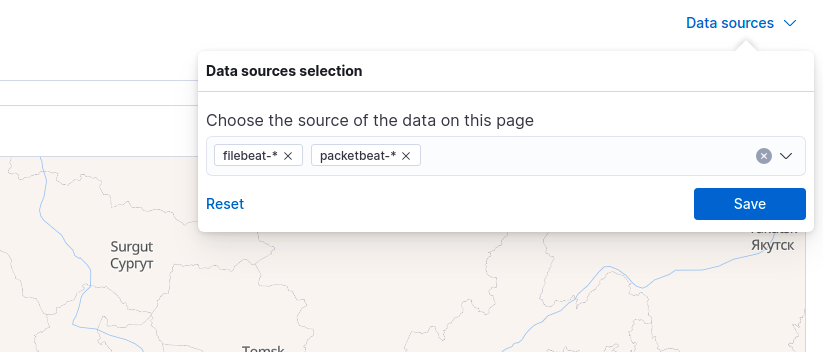
If everything went fine which is installting Elasticsearch, Kibana, beats on your client hosts and configuration of HAProxy, NGINX, then you can open Security, Explore, Network section and hit refresh buton to load data into map. But first you need to select Data sources (link above the map, on the right side), include filebeat-* index pattern.
Fig. Filebeat data source selection
With such configuration you should be able to see geo points representing client locations.
Fig. Location points based on filebeat data
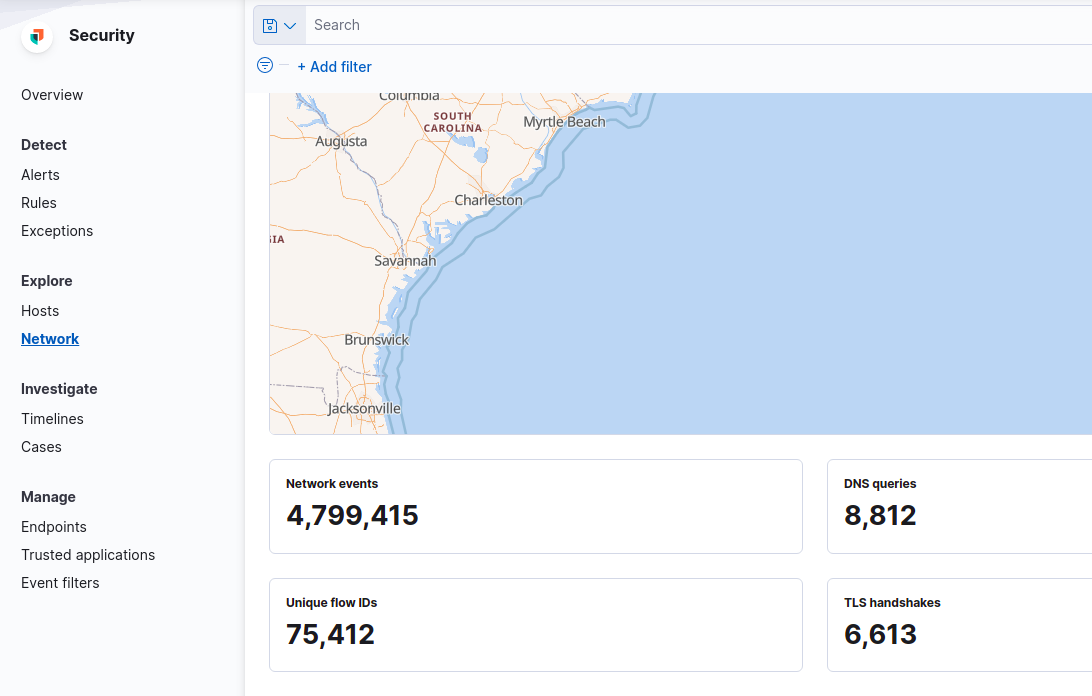
In case you also enable Packetbeat, you will see also networking information data below the map.
Fig. Networking information data
Please remember that enabling Packetbeat generates tons of data in complex environments, so be sure to allocate enough space for these indices.
Summary
This guide covers the basic path for installting Elasticsearch, Kibana, Beats and configuring HAProxy and NGINX to deliver traffic, logs to Elasticsearch and be able to visualize traffic as geo location points.