Did you know that you may block AI-related web-scrapers from downloading your whole websites and actually stealing your content. This way LLM models will need to have different data source for learning process!
Why you may ask? First of all, AI companies make money on their LLM, so using your content without paying you is just stealing. It applies for texts, images and sounds. It is intellectual property which has certain value. Long time ago I placed on my website a license “Attribution-NonCommercial-NoDerivatives” and guest what… it does not matter. I did not receive any attribution. Dozens of various bot visit my webiste and just download all the content. So I decided…
… to block those AI-related web-crawling web-scraping bots. And no, not by modyfing robots.txt file (or any XML sitemaps) as it might be not sufficient in case of some chinese bots as they just “don’t give a damn”. Neither I decided to use any kind of plugins or server extenstions. I decided to go hard way:
And decide to which exactly HTTP User Agent (client “browser” in other words) I would like to show middle finger. For those who do not stare at server logs at least few minutes a day, “Bytespider” is a scraping-bot from ByteDance company which owns TikTok. It is said that this bot could possible download content to feed some chinese LLM. Chinese or US it actually does not matter. If you would like to use my content, either pay me or attribute usage of my content. How you may ask? To be honest I do not know.
There is either hard way (as with NGINX blocking certain UA) or diplomacy way which could lead to creating a websites catalogue which do not want to participate in AI feeding process for free. I think there are many more content creators who would like to get some piece of AI birthday cake…
Logging all HTTP traffic is often unnecessary. It especially applies to website which include not only text content but also all kind of additional components, like JavaScripts, stylesheets, images, fonts etc. You can select what you would like to log inclusively, but it is much easier to do this by conditional negative selection. First define log format, then create conditional mapping, last thing is to specify logger with decision variable. For instance:
This way we are not going to log any of additional stuff and keep only regular pages in the log. Will be more useful for further traffic analysis than filtering out those things manually.
Note: for more resilent setup install more than one Elasticsearch server node and enable basic security. For sake of clarity I will skip these two aspects which will be covered by another article.
Now be sure to configure both Elastic and Kibana. For Elastic it is /etc/elasticsearch/elasticsearch.yml configuration file. Be sure to set the following (change 0.0.0.0 with your local IP address):
sudo systemctl enable kibana
sudo service kibana start
Be sure to check if both Elasticsearch and Kibana are up and running with service or systemctl. If everything is fine proceed to setup Filebeat, Packetbeat on client hosts. There is separate guide how to do this. In beats configuration file point to Elasticsearch server you just installed.
HAProxy on pfSense
Example setup includes gateway, which is pfSense with HAProxy package. Configure two frontends, one for HTTP at 80 and one for HTTPS at 443. On HTTP frontend configure
Action http-request redirect
rule: scheme https
On HTTPS configure certificate and check SSL Offloading. Of course you need to load this certificate in System, Cert. Manager. Configure your backends and select it on HTTPS frontend. Now, go to HTTPS frontend and check the following:
Use "forwardfor" option
It is required to be able to read client IP in backend NGINX.
Filebeat on client host
On client hosts install filebeat package. There is separate guide for this one. Edit configuration file, which is /etc/filebeat/filebeat.yml:
filebeat.inputs:
  enabled: false
And then setup and enable NGINX module:
filebeat setup
filebeat modules enable nginx
Now, you are good to go with delivering log files, but first you need to point them in the configuration at /etc/filebeat/modules.d/nginx.yml:
You can use it in application configuration file at /etc/nginx/conf.d/app.conf in the server stanza:
access_log /var/log/nginx/app.log mydefault;
Restart your NGINX server and go to Kibana to explore your data. You need to add this log format, in order to handle client IP which is present in $http_x_forwarded_for variable. This format as close as possible to the default one.
Network geo location map
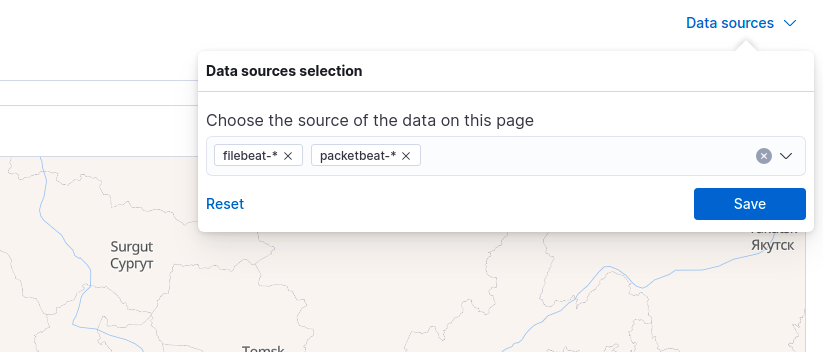
If everything went fine which is installting Elasticsearch, Kibana, beats on your client hosts and configuration of HAProxy, NGINX, then you can open Security, Explore, Network section and hit refresh buton to load data into map. But first you need to select Data sources (link above the map, on the right side), include filebeat-* index pattern.
Fig. Filebeat data source selection
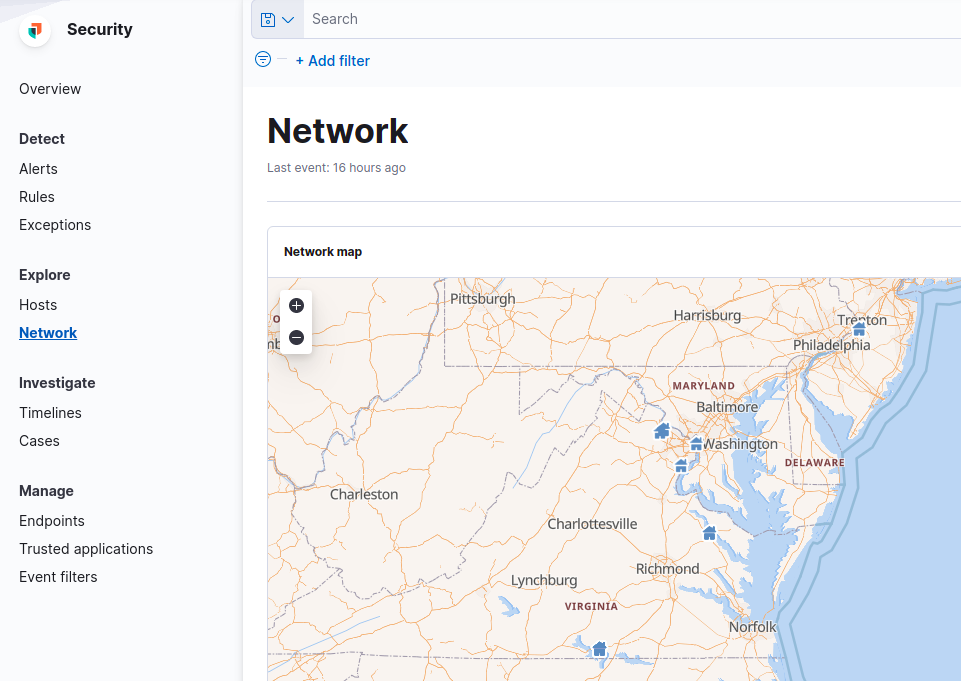
With such configuration you should be able to see geo points representing client locations.
Fig. Location points based on filebeat data
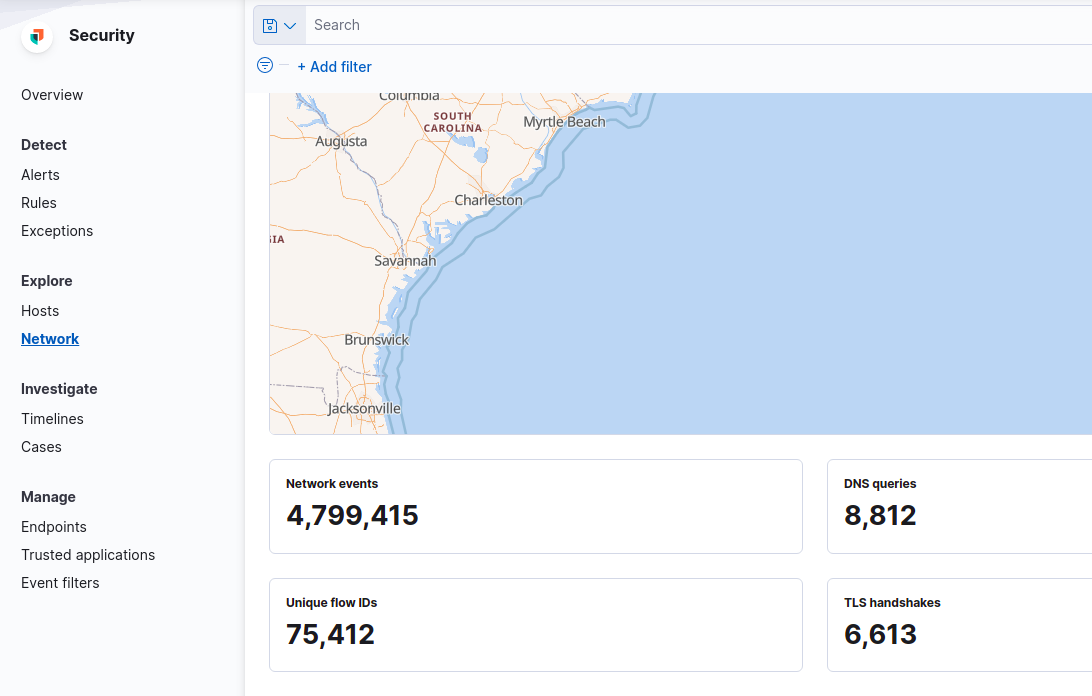
In case you also enable Packetbeat, you will see also networking information data below the map.
Fig. Networking information data
Please remember that enabling Packetbeat generates tons of data in complex environments, so be sure to allocate enough space for these indices.
Summary
This guide covers the basic path for installting Elasticsearch, Kibana, Beats and configuring HAProxy and NGINX to deliver traffic, logs to Elasticsearch and be able to visualize traffic as geo location points.
I will start with the werid experience with one of WP themes – Polite and Polite Grid. I was wondering why my website make double requests on every page. One for the document and other for content. This was annoying as I was unable to measure traffic properly. It turned out that it was because of the theme I’ve been using for some time. Changing it to different one fixed it.
Second of all to make NGINX logs easier to handle I’ve created separate location entry for all the WP things, so the “real” traffic goes only to particular log and everything else goes in different place. Take a look:
The most recent min.io server release requires one additional thing in the configuration comparing to versions in the past years. Having min.io on one box and NGINX on another one requires setting up a reverse proxy, which is straightforward operation. You need to remember to add proper headers to pass hostname and schema to min.io box. This whole thing is described in the documentation.
But… you are required to put the following into a min.io configuration file:
MINIO_SERVER_URL="https://your.url/"
This should be put in bold letters beause without this one you could upload artifacts into buckets, but will not be able to download them with share link beacuse of checksum error. This checksum depends on domain name. Default min.io installation offers a console and API on one port only in theory. If you go for console then you are redirected to some temporary port, applicable until next restart of the server. So API will work flawlessly on public domain, but a console in the default installation will not. Please keep that in mind.