Data Mining & Exploration
Among 3 million public IP address ranges for the whole world, 68k belongs to the Russian Federation. This translates into 45 million addresses. Scanning the HTTP port on this population took 20 hours. I obtained 630k IP addresses with listening on port 80. Of which 530k gives the correct answer of the HTTP type. Only 340k gives an HTTP 200 response. Over 200k run on NGINX servers, and 100k run on Apache. When analyzing the content, you will find GitLab, Kibana, Zabbix or Grafana installations open for registration and use, but also copies of databases, video surveillance systems, etc. My favorite find, however, is the control panel of the heat plant…
When I bought the HP z800 workstation at the beginning of 2021, I wanted to increase my competences in the field of hardware and software optimization on the one hand, and on the other hand, describe it in the form of a publication in order to consolidate my knowledge sufficiently. Over the course of the following months, the concept changed dramatically, and I needed more information. I decided that I needed to expand my knowledge of hardware construction. The final part of this was the development of the concept of a series of notebooks entitled “Simple High Performance Computing“, or HPC in an edition available basically for everyone in every budget.
Table of Contents
- A few words about the series of notebooks
- Target group
- Tools
- Hardware
- Loading addresses
- zmap scanning of HTTP servers
- Qualitative verification
- Analysis of the results
- Configuration analysis
- Content analysis
- Going to the end
- Contact
A few words about the series of notebooks
6 parts are planned in the series, 2 have already been completed and released
The first part of the series is “Fundamentals of electronics and building a computer in a simulator” published in 2021 (available for download at this address). The second part (number 5 in the series) was “OpenCL, CPU and GPU programming” released in May 2022 (available for download at this address). In addition to these two items, the series also includes parts for the review of computer platforms from the 1980s to now, including MOS 6502, Intel SSE, AltiVec, OpenGL and possibly ESP8266. The last part is “Data Mining & Exploration“, which is the subject of this particular article.
Target group
Using the ip2location database to scan the selected territory
I take a few services as an example for data mining, but I’ll start with the basic ones, HTTP and DNS . I identify the target group using the ip2location database. It is a collection of ranges on the public internet with information about the belonging to a given territory. Today we have 2 975 657 pieces of all IPv4 Internet ranges. Loaded into PostgreSQL 14, they take 405 MB. In the ip2location database, the ip2location_db11 table stores ranges of public IPv4 addresses. It is the broadest free collection containing granularity of locality and approximate location data . There is also a zip code here. Of course, in the case of larger towns and cities, there may be many such codes.
Note: ip2location database is also available in commercial version, where we get additional metadata and geolocation is much more precise. The database has ranges for 242 territories. Interestingly, the World Bank’s WDI database defines 265 territories, and there are 193 members of the United Nations. Both databases try to follow the letter of the law regarding the recognition of individual countries. So even if a territory is dependent on another country, but it is generally recognized, such territory will have separate data, for example, Nothern Mariana Islands. However, we will not find the Republic of Artsakh or Kosovo.
Tools
For exploration, I use zmap, dig and an application written in Ruby
The zmap program is designed for high-performance scanning of network spaces. It is assumed that on properly selected equipment and Internet connection, you can scan the entire IPv4 space within a few hours on a selected TCP port. Of course, this type of mass scans can put your address on the fraud lists and be de facto blocked in many places around the world. There are two strategies to avoid this. The first is to use a separate space for such scanning, e.g. a virtual machine in a public cloud (DigitalOcean, Rackspace, Microsoft Azure, etc.). At the beginning of my adventure with this type of scans, I chose this option myself. After informing the supplier about the scheduled scanning, we should not have any problems, it is only worth mentioning that these are research works. The second strategy I am currently using is scanning at lower bandwidth, clearly defined regions in the world. The downside of this solution is, of course, lower efficiency, resulting from the need to operate on CIDR blocks that are usually not adjacent to the networks so that they can be merged. Not being able to randomize scanning is a major drawback.
As for dig , I use it to test DNS server responses, but also as a reverse IP address to domain name mapping tool for the entire address population. Domain analysis for HTTP services is interesting, but it is more interesting to map domains for all IP addresses, but it requires the use of more DNS servers so as not to be blocked on the most popular ones.
The whole, i.e. both zmap and dig based tasks are merged using an application I called miner, made in Ruby and Ruby on Rails , used for orderly execution such operations step by step. Basically the app only uses ActiveRecord , Rake and HTTParty so it’s a bit exaggerated to say that this is a Rails app. For more demanding operations, I use dedicated modules and methods for HTTP connections, because HTTParty has various limitations and errors that easily come to the surface at such a scale. The same goes for the Parallel library, which is obviously invaluable in the context of concurrent work, removing the need for the user to work directly on threads and processes, but has a number of unresolved bugs and memory leaks.
Note: if I find some free time, I will try to repeat long-distance attempts to reveal memory problems of the libraries, so I will have an evidence to report bugs to their creators .
Hardware
Paradoxically, mass scanning does not require too powerful equipment
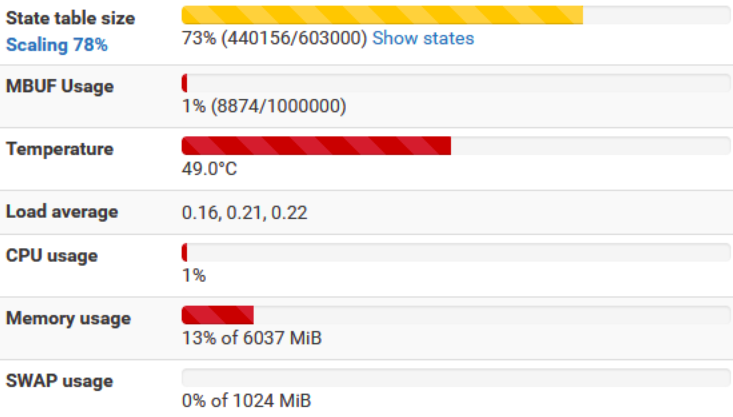
As I mentioned in the introduction, I use the HP z800 workstation for this work, which accepts a maximum of 2 CPUs, each with 12 threads, for a total of 24 logical processors per station (Intel Xeon X5660). I used two of such workstations for the test, so I had 48 processors in total. As for the operating memory, the maximum for such a set is 768 GB DDR3, although I only have 180 GB installed. Scanning and the activities around it are not memory-intensive, they require a large amount of CPU and a stable network on the hardware and network software layer. I used my 1 Gbps downlink and 600 Mbps uplink to scan. The network traffic is managed by the installation of pfSense 2.6 on dedicated hardware with the Intel Xeon E3 1230 processor. At the peak of the scan, the number of states on the firewall reached 500,000, which was due to the liberal configuration. With a bit more strict control of states, the number can be significantly smaller, but then we increase the risk of closing good states.
Note: Scanning can generally be performed on any hardware with a decent network card. What is meant by decent? First of all, it should be a minimum 1 Gbps card, and preferably with a speed of 10 Gbps. It should be made by a reputable manufacturer. It should also be a popular model with a current firmware available.
Loading addresses
Translate ranges to proper IPv4 public addresses
The procedure begins with the conversion of IP ranges in CIDR notation to the proper atomic IP addresses. Since ranges are represented numerically, we can use Ruby’s Range class to do this:
def convert_ip_range(start_ip, end_ip)
  start_ip = IPAddr.new(start_ip)
  end_ip   = IPAddr.new(end_ip)
  (start_ip..end_ip).map(&:to_s)
end
The actual task generating addresses from ranges is as below. Originally, this task was adapted to generate addresses from ranges for countries with an allocation of less than 5 million addresses, there are about 200 such territories.
  desc "Generate and insert IP list based on IP2Location IP ranges"
  task :generate_ip_list_from_ip_range => :environment do
    sql = "SELECT country_code, SUM(ip_to-ip_from) AS cnt
            FROM ip2location_db11
            WHERE country_code IN
              (
                SELECT DISTINCT a.country_code
                FROM ip2location_db11 a
                LEFT JOIN servers b ON a.country_code = b.country_code
                WHERE b.country_code IS NULL
              )
              AND country_code = 'RU'
            GROUP BY country_code;"
    res = IpAddress2.connection.execute(sql) # ip2location_db11
    res.each do |r|
      puts r.inspect
      ranges = IpAddress2
                .where("country_code = ?", r["country_code"])
                .select("'0.0.0.0'::inet + CAST(ip_from AS bigint) AS mfr,
                         '0.0.0.0'::inet + CAST(ip_to AS bigint) AS mto,
                	  country_code, country_name, region_name, city_name,
                          latitude, longitude, zip_code, time_zone")
      ranges.each_with_index do |range,index|
        puts "from: #{range.mfr}, to: #{range.mto}"
        if !range.mfr.blank? && !range.mto.blank? then
          ips = convert_ip_range(range.mfr.to_s, range.mto.to_s)
          elements = []
          cnt = 0
          ips_size = ips.size
          puts " ips_size: #{ips_size.to_s}"
          ips.each_with_index do |ip,index2|
            s = Server.new
            s.ip = ip
            s.country_code     = range.country_code
            s.geo_region_name  = range.region_name.gsub("'", "")
            s.geo_city_name    = range.city_name.gsub("'", "")
            s.geo_latitude     = range.latitude
            s.geo_longitude    = range.longitude
            s.geo_zip_code     = range.zip_code
            s.geo_time_zone    = range.time_zone
            cnt = cnt + 1
            elements << s
            if cnt >= 500 || index2+1 == ips_size then
              puts " #{cnt.to_s}: importing #{elements.size.to_s}"
              Server.import(elements, returning: :ip)
              elements = []
              cnt = 0
            end
          end # ips
        end # if blank
      end # IP ranges
    end # SQL res
  end # task
The range generation has several imperfections. The final number of the resulting addresses is greater than that declared by ip2location and it is not due to the generation of subnet and broadcast addresses. However, this is of little importance in the overall scale. Generating in this form takes several hours depending on the adopted size of the batch package (500, 1000 or other).
zmap scanning of HTTP servers
Quantitative qualification using zmap
There are two approaches to performing a scan and it is not about distinguishing whether we are scanning from a location other than ours or scanning at a slow pace. It’s about the launch mode. We can scan in series or in parallel. Serial scanning is slow and range merges are difficult to accomplish in a short time. We can try to merge smaller ranges (subnets / 24) into larger ones (e.g. / 16) using the Ruby NetAddr module:
result = NetAddr.summ_IPv4Net(cidrs)Unfortunately, the code of this module is suboptimal and fails to execute properly due to memory error, cavities and overall huge processing time. Perhaps someday I will find a moment to write an alternative, but the problem is only apparently simple. In any case, in order to generate a CIDR range from a numeric range, we again need the code snippet as below:
 def iprange2netmask(ipstart, ipend)
    if ipstart.kind_of?(String) || ipend.kind_of?(String)
      startR = ip2long(ipstart)
      endR = ip2long(ipend)
    else
      startR = ipstart
      endR = ipend
    end
    result = Array.new
    while endR >= startR do
      maxSize = 32
      while maxSize > 0 do
        mask = (iMask(maxSize - 1))
        maskBase = startR & mask
        if maskBase != startR
          break
        end
          maxSize-=1
      end
      x = Math.log(endR - startR + 1)/Math.log(2)
      maxDiff = (32 - x.floor).floor
      if maxSize < maxDiff
        maxSize = maxDiff
      end
      ip = long2ip(startR)
      netmask = cidr2netmask(maxSize)
      cidr = [ip, netmask].join('/')
      result.push("#{ip}/#{maxSize.to_s}")
      startR += 2**(32-maxSize)
    end
    return result
  end
  def iMask(s)
    return (2**32 - 2**(32-s))
  end
  def long2ip(num)
    return IPAddr.new(num, Socket::AF_INET).to_s
  end
  def ip2long(ip)
    return IPAddr.new(ip).to_i
  end
  def cidr2netmask(cidr)
    IPAddr.new('255.255.255.255').mask(cidr).to_s
  end
Having a ready method for translating a numerical range into a CIDR range, we can generate scanning scripts using the following task. The task creates the necessary directory structure where the scripts using the zmap program will be placed. The parameters used for scanning are 100 Mbps bandwidth and 2 attempts. In the zmap configuration in the /etc/zmap/zmap.conf file, I also indicated the waiting time for the response in the cooldown-time parameter of 2 seconds.
 desc "zmap to port X"
  task :generate => :environment do
    port = 80
    countries = Server.all
                  .select("country_code, count(*) AS cnt")
                  .group("country_code").order(Arel.sql("COUNT(*) ASC"))
    countries.each do |c|
      puts "#{c.country_code}: #{c.cnt}"
      ranges = IpAddress2
                 .where("country_code = ?", c.country_code)
                 .select("'0.0.0.0'::inet + cast(ip_from AS bigint) AS mfr,
                          '0.0.0.0'::inet + CAST(ip_to AS bigint) AS mto, country_code")
      if Dir.exist?("/opt/repos/zmap/#{port}/{c.country_code}") then
        next
      else
        FileUtils.mkdir_p("/opt/repos/zmap/#{port}/#{c.country_code}")
        FileUtils.mkdir_p("/opt/repos/zmap/#{port}/#{c.country_code}/scripts")
        FileUtils.mkdir_p("/opt/repos/zmap/#{port}/#{c.country_code}/scripts/done")
        FileUtils.mkdir_p("/opt/repos/zmap/#{port}/#{c.country_code}/results")
      end
      ranges.each_with_index do |range,index|
        path = "/opt/repos/zmap/#{port}/#{c.country_code}/scripts/run_#{range.mfr}_#{range.mto}.sh"
        iprange2netmask(range.mfr.to_s, range.mto.to_s).each_with_index do |cidr,index2|
          puts "RANGE: #{range.mfr} do #{range.mto}"
          command = "zmap --bandwidth=100M --target-port=#{port}
           --output-file=/opt/repos/zmap/#{port}/
                         #{c.country_code}
                         /results/#{range.mfr}_#{range.mto}.csv
           --probes=2 #{cidr}\n"
          File.write(path, command, mode: "a")
        end # cidrs
        command2 = "ping -c 1 1.1.1.1\n"
        File.write(path, command2, mode: "a")
        command3 = "if [ $? -eq 0 ];
                    then mv #{path} /opt/repos/zmap/#{port}/#{c.country_code}/scripts/done;
                    else echo '!';
                    fi\n"
        File.write(path, command3, mode: "a")
      end # ranges
    end # countries
  end # task
Regardless of how we run the task, whether in series or in parallel, we will face the same problems when it comes to completeness of the results obtained. We are talking about waiting time for an answer. By default, zmap uses up to 8 seconds of waiting, which means a lot of delays with many subnets with the CIDR / 24 mask. Scanning 256 hosts (minus the network address and broadcast address) takes a blink of an eye, so the subsequent waiting of 8 seconds is definitely redundant here. At the same time, if we set this parameter to 1 second, it may turn out that we lose correct answers that have not reached us due to delays on the backbone network or even on our local network.
If we don’t want to aggressively optimize the pfSense configuration in terms of state performance, then we have to increase the RAM memory so that all the redundant states fit. You need at least 4 GB to be able to start such a scan. Anything above increases the possibilities, and 16 GB is preferable. By the way, we will have the opportunity to know, as well as I, that pfSense has special optimization mechanisms when there are a number of states above certain thresholds.
Parallel processing was achieved by using the Parallel library. By trial and error, I determined that with 6 GB of memory, it would be optimal to use 4 processes. I also tried higher values, e.g. 16 processes, but I would have to install 16 or even 32 GB of memory into pfSense. It could also have a negative impact on the use of the local network as such. I used the following task for parallel processing.
  desc "run zmap in parallel"
  task :run => :environment do
    country_code = "RU"
    port         = 80
    scripts = Dir["/opt/repos/zmap/#{port}/#{country_code}/scripts/*"]
    Parallel.map(scripts, in_processes: 4) do |script|
      puts "#{Parallel.worker_number} => #{script}"
      system(script)
    end
  end
Scanning took 20 hours. During this time, zmap only sent 5 GB of data packets. 45 million atomic IP addresses were scanned from 68k ranges and 177k lowest order networks. The result is 630k addresses where listening on port 80. This does not mean that there are HTTP servers there, just that the server responds to packets sent by zmap. This is a quantitative qualification. In the last step, the results were transferred to the database, to a dedicated table based on the results.
Note: I know from my own experience that zmap scans can be detected using signatures in IPS / IDS applications such as Suricata. Perhaps, therefore, some hosts did not respond, because they detected in proactive mode that a zmap scan was being performed. What is certain is that a system of this kind may block further communication from the source address for some time. It is therefore a good practice to wait 24 hours before attempting qualitative verification on these hosts.
Qualitative verification
Analysis of content offered by remote hosts
I started working with HTTP servers by saying that on such a large population of hosts there is too much variation in protocol implementations that the use of a simple and convenient HTTParty library is insufficient. At first glance, I needed a dedicated method that wouldn’t make any far-reaching assumptions about the operation of the remote host. Here is the code.
module FetchUtil
  # Fetch a URL, with a given max bytes, and a given timeout
  def self.fetch_url url, timeout_sec=4, max_bytes=1*1024*1024
    uri = URI.parse(url)
    t0 = Time.now.to_f
    body = ''
    code = nil
    headers = []
    Net::HTTP.start(uri.host, uri.port,
               :use_ssl => (uri.scheme == 'https'),
               :open_timeout => timeout_sec,
               :read_timeout => timeout_sec) { |http|
      # First make a HEAD request and check the content-length
      check_res = http.request_head(uri.path)
      code = check_res.code
      raise "File too big" if check_res['content-length'].to_i > max_bytes
      # Then fetch in chunks and bail on either timeout or max_bytes
      # (Note: timeout won't work unless bytes are streaming in...)
      http.request_get(uri.path) do |res|
        res.each_header do |k,v|
          headers << [k,v]
        end
        res.read_body do |chunk|
          raise "Timeout error" if (Time.now().to_f-t0 > timeout_sec)
          raise "Filesize exceeded" if (body.length+chunk.length > max_bytes)
          body += chunk
        end
      end
    }
    return [code, body, headers]
  end # fetch_url
end # module
This code has two constraints, size and time. We limit the size to 1 MB of data and 4 seconds of waiting for the result. This is part of a larger task that is responsible for concurrent verification. The module described above is used, but also HTTParty, where there is a 3xx response code. I am also trying to convert the ASCII-8BIT to UTF-8 encoding, but this is a very extensive topic, especially that the selected territory does not use the Latin alphabet.
def perform_verify
    @reconnected ||= Server.connection.reconnect! || true
    port = 80
    Parallel.each_with_index(Server80.where("is_checked is false ")
            .limit((1024*64)), in_processes: ENV['PC'].to_i * 1) do |s,index|
      $stdout.sync = true
      @reconnected ||= Server80.connection.reconnect! || true
      puts "#{Parallel.worker_number}: #{index}: (#{ENV['PC'].to_i*1}): #{s.ip}: #{s.country_code}"
      start = Time.now
      begin
        resp     = FetchUtil.fetch_url("http://#{s.ip}:#{port}/")
        code     = resp[0]
        body     = resp[1]
        hdrs     = resp[2]
        if code.to_s[0] == '3' then
          puts " switching to httparty as 3xx"
          response = HTTParty.get("http://#{s.ip}:#{port}", timeout: 2)
          code = response.code
          body = response.body
          hdrs = response.headers
        end
        if true
          str = body
          enc = body.encoding rescue nil
          puts " #{enc}"
          if enc.to_s == "ASCII-8BIT" then
            str = body.force_encoding(enc).encode('utf-8', invalid: :replace, undef: :replace)
            str.scrub!("")
            str.gsub!(/[[:cntrl:]&&[^\n\r]]/,"")
          end
          doc = Nokogiri::HTML(str)
          s.headers  = hdrs
          s.content  = str
          s.csize    = str.size
          s.title    = doc.xpath("//title").text
          s.start    = start
          s.finish   = Time.now
          s.diff     = (s.finish - s.start).in_milliseconds
          s.result   = code[0..999]
          if    code.to_s[0] == '1' then
            s.is_1xx = true
          elsif code.to_s[0] == '2' then
            s.is_2xx = true
          elsif code.to_s[0] == '3' then
            s.is_3xx = true
          elsif code.to_s[0] == '4' then
            s.is_4xx = true
          elsif code.to_s[0] == '5' then
            s.is_5xx = true
          end
          puts " .. #{s.result} -#{s.result.size}- .. #{s.title} .."
          s.is_checked = true
          s.save!
        end
      rescue Exception => e
        puts " exception: #{e}"
        s.content = nil
        s.title = nil
        s.result = e.to_s[0..999]
        s.is_checked = false
        s.is_http_error = true
        s.save!
      end
    end # parellel
  end # task
I use Nokogiri and xpath selectors to process responses. When the task with 24 processes was running, the number of states on pfSense was from 30k to 40k. The combination of Parallel and HTTParty and closer to unknown hosts often causes processes to be blocked. It seems that the main culprits here are Parallel and its compatibility with other elements, because this behavior is also observed in other projects, where there is no HTTParty library used, but only ActiveRecord. There is an option of full process separation, but it causes a drastic drop in performance, which generally disqualifies this option. There is also another explanation that may explain this behavior in part. Well, some of the hosts offer streaming services which is difficult to identify. They might send fake HTTP metadata, but actually offer something completely different.
Moving on to the analysis of the results, the correct answer was sent by 522k hosts plus 8k hosts in the retry. This gives a total of 530k correct answers and 99k various types of connection errors on the HTTP protocol. I did 5 full runs to confirm that the failed hosts did indeed permanently offer no HTTP content. 16% of the hosts that answered port 80 are incorrect. The division among incorrect answers is as follows.
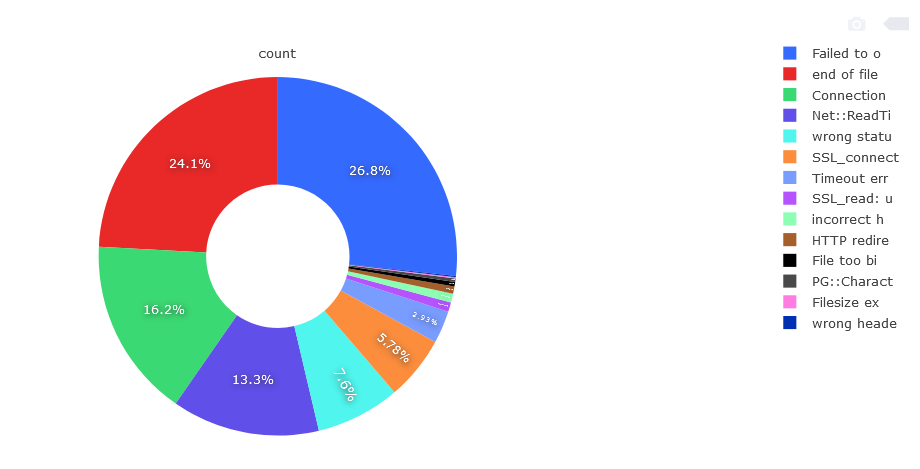
“Failed to open TCP connection” is responsible for the biggest part of errors, 26.8%, 26398 items. Second in line is “end of file reached“, 24.1%, 23817 units. Third place is “Connection reset by peer“, 16.2%, 15986 units. Next are Net :: ReadTimeout, “wrong status line“, SSL_connect, TimeoutError, SSL_read, HTTP redirects, “File too big“. The remaining error messages are responsible for a small percentage and there are a lot of different types. They result from running non-HTTP services on port 80 and 443. Among correct HTTP responses, i.e. a pool of 530k hosts are divided into the following division.
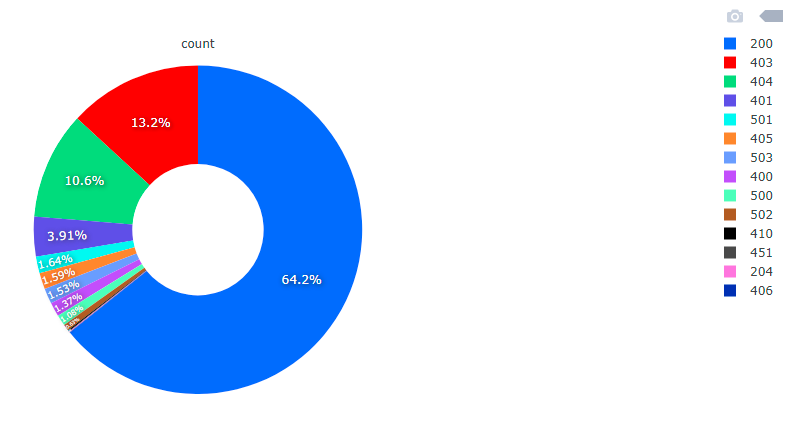
HTTP response codes are divided into 5 categories. Codes starting with 1 are info codes. Codes starting with 2 are correct answers. Codes starting with 3 are redirects of various types, additional action is required. Codes starting with 4 are client errors that prevent further processing of the request. Codes starting with 5 are server errors. The list of HTTP response codes is maintained by IANA.
HTTP 200 codes are 340k. We have codes 403 with number of 69k. We have 56k codes 404. We have 20k codes 401. The remaining group of a dozen or so types of answers is below 10k each of these types.
Analysis of the results
Configuration and content
We can consider the content offered by HTTP servers from several angles. First of all, it should be noted that when we talk about public IPv4 addresses, we are talking about either physical or virtual network adapters. In both cases, multiple domains may be running on a given host based on SNI. These hosts can and certainly act as entry points for a subnet (NAT or proxy). Of course, this does not apply to all addresses, only parts. What, it is not known. The analysis may concern the HTTP server as such, its type, version and configuration, or the content returned by this server. Both analyzes bring many interesting facts.
Configuration analysis
Operating systems and runtime platforms
When examining the configuration, I find that among all the answers, 217k hosts are supported by the NGINX server, 96k through the Apache server, and 20k by the Microsoft IIS server. The most popular HTTP servers are responsible for a total of 334k addresses. There are 7810 of all the varieties of the reported servers. The more interesting less popular servers are Webrick, Lotus-Domino or Mongrel, but also MinIO and WowzaStreamingEngine. There are also print servers, Couchbase and many more. From the series of these strange ones, I would single out “Aeroflot“, “Stalin” or the “ZX Spectrum“. However, to indicate something specific, I would say that it is NGINX 0.4.13 from 2006 or Phusion Passenger in an older version. In general, all older versions of HTTP servers may be subject to exploit tools.
Another aspect of the configuration study is the operating systems and runtime platforms on which the HTTP hosts and servers are running. Servers with a declared Windows system are 5257 pieces. By contrast, Ubuntu Linux is 52473 units, Debian is 16438 units. Among other popular systems, it is CentOS in the amount of 31176 units. The FreeBSD system is also popular with a total of 3326 units. The most popular technology stack we know about from the headers is PHP. It is not, however, that this information is confirmed, because basically only this language module is widely advertised, and the others are simply not. We will not find such information in the case of Java or Ruby languages. The exception will be the Perl as Apache module. It occurs in 662 pieces.
Information about the operating system or runtime platform, and in particular their versions, is important from the point of view of the security of such hosts. A Linux or FreeBSD host is just as vulnerable as a Windows host . This is because they can be misconfigured in the first place, and not so much vulnerable. Windows systems are much more popular from workstations than servers, hence the large majority of threats present on this system. When it comes to vulnerabilities, the first choice is metasploit, which will give us information whether the vulnerabilities on the hosts can be exploited.
Note: it is important to know that “Data Mining & Exploration” is about information and fact-finding, not security hacking and misconfiguration.
Content analysis
Systems and applications
In addition to the configuration of servers, we can examine what content they return. This allows us to get to know the specificity of the studied region better. For different services are launched in Europe, others in Asia and others in Africa. There are some common points, but in general, the level of development of a given territory has an impact on how many and what services we can find there in the Internet space. I analyze the content by looking for a few of the most popular systems that may most often be incorrectly configured. These are GitLab, Kibana and Elasticsearch, file servers, Zabbix and Grafana. In each of these, there may be an open registration situation, no access control, or an active guest account.
GitLab
Starting with GitLab , I found 598 installations. I tried registration on several of them. Most of them required confirmation of the account by the administrator, but on a few I was able to register and have an active account with access to resources right away. By resources, I mean mostly code repositories. I estimate a fully functional account could be obtained for approximately 5-10% of installations.
Note: Let me not give you specific addresses. It is true that I informed the administrators of these installations about a configuration error, but none of them responded to my report. They may be abandoned installations or the contact is out of date.
Elasticsearch, Kibana
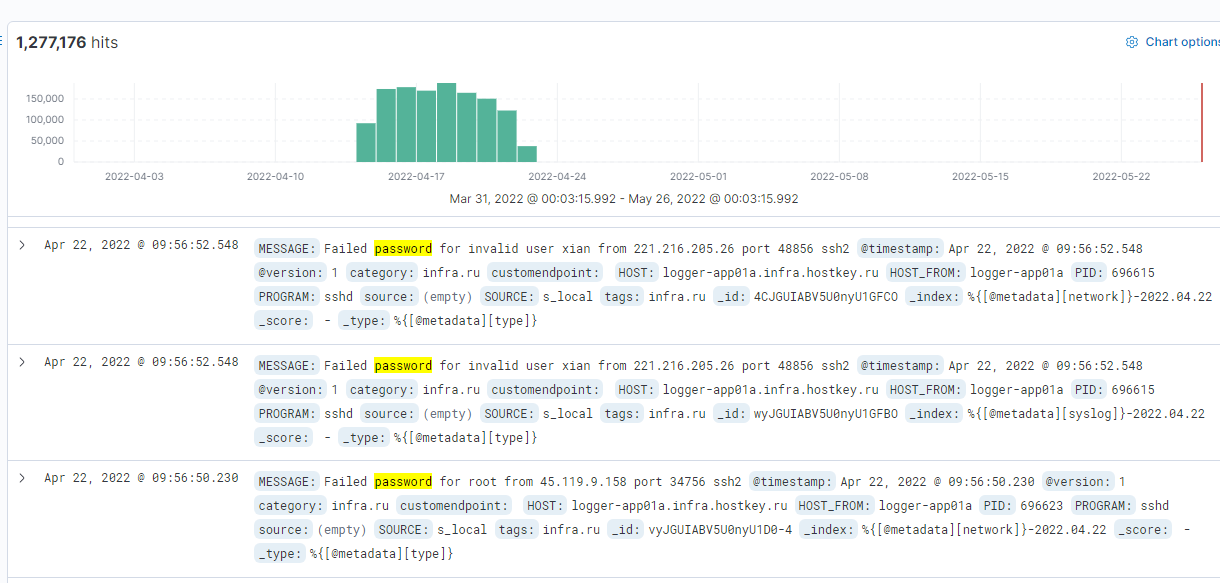
The second system I was looking for was Kibana connected to Elasticsearch. I consider the fact that there are installations on port 80 as an obvious example of a configuration error, because by default Kibana runs on port 5601, so someone had to reconfigure or set up a reverse proxy.
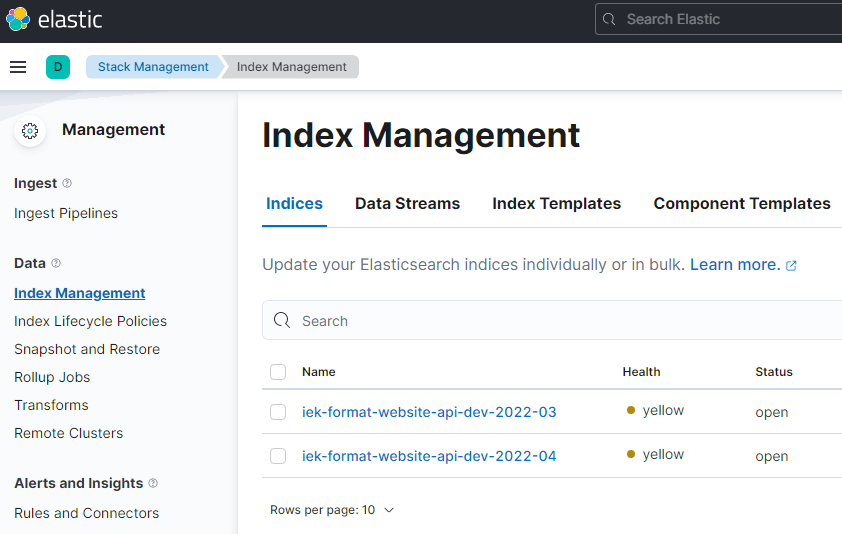
Providing Kibana may result in the display of indexes (logs, metrics and network packages), including the possibility of downloading or even deleting them. By default, the interface does not allow you to retrieve the content of indexes, but if you use the appropriate console tool, it will be able to do so. Often times, if port 80 contains Kibana, the 9200 and 9300 contain Elasticsearch services, also publicly available. As part of the Elasticsearch and Kibana systems, we have one more service, namely the APM server, i.e. application monitoring.
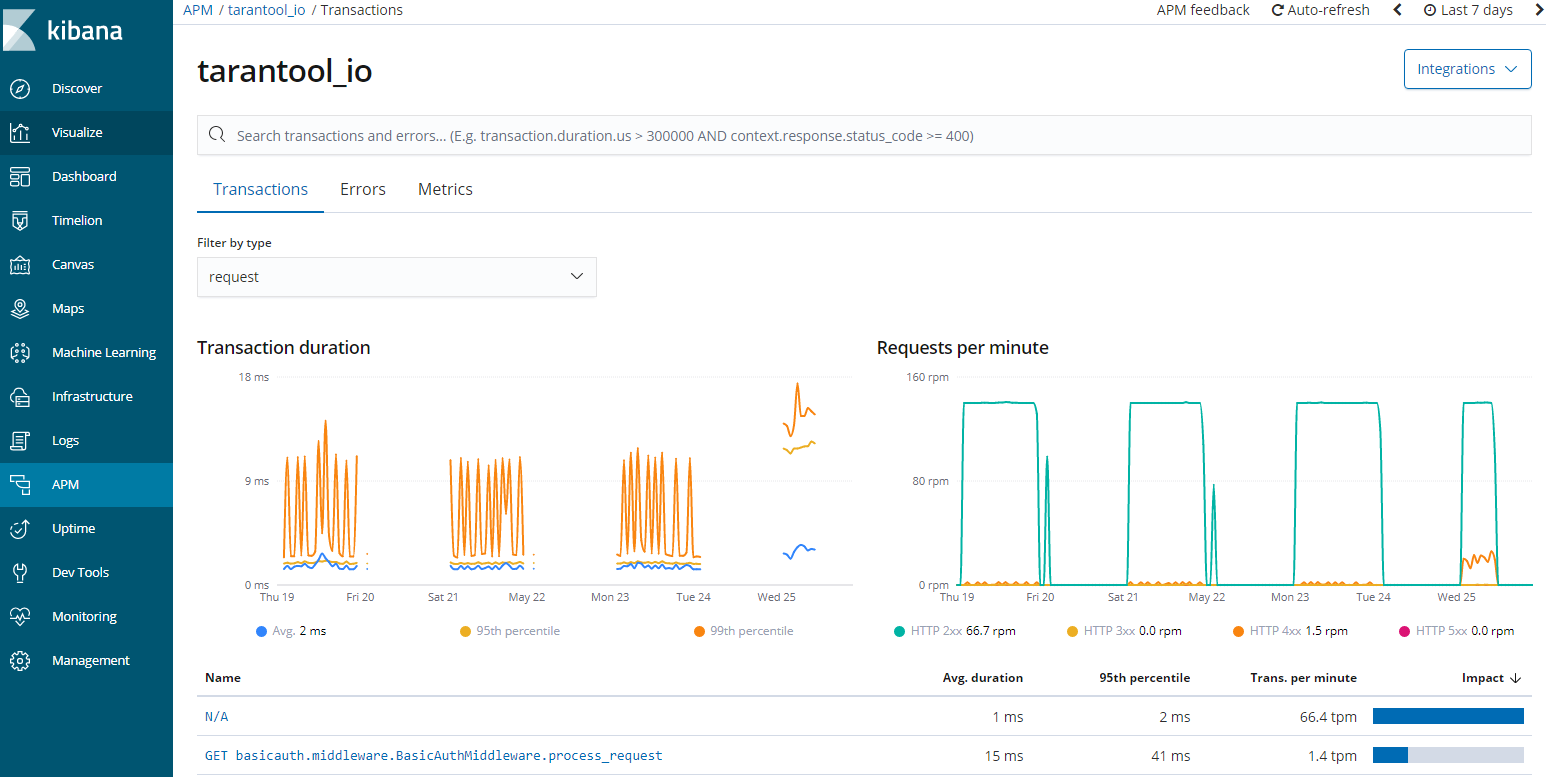
Exposing diagnostic data about the application results in increased possibilities of exploring such an application, because APM provides information about the database, related services and addresses on which the application operates on the HTTP layer. Elasticsearch, beats and Kibana is a powerful tool that can give us a lot of information in the form of a reconnaissance of the network environment.
Files listing
The third type of resource is file stores in the form of file listings on the HTTP server . I found almost 3000 of such installations. Among the more interesting finds I can mention copies of databases, video surveillance archive or code repositories . There are also scans of documents, bank transfer confirmations, certificates and many more. Some users of these servers may not know they have a public IP. Their IP can be dynamic but public. The second category are people who think that only they know this IP address, which is an obvious mistake, because addresses are commonly known.
Note: Domain addresses (especially subdomains) are not widely known, unless we are talking about reverse DNS mapping. The DNS issue is material for the next article.
Zabbix
The fourth type is 636 Zabbix monitoring system installations. It should be on a private network with access behind WAF or VPN, but that’s not the case in these cases. Moreover, many of them allow access under the guest account. Basically, it is wrong that such data is publicly available because it identifies the system on multiple layers.
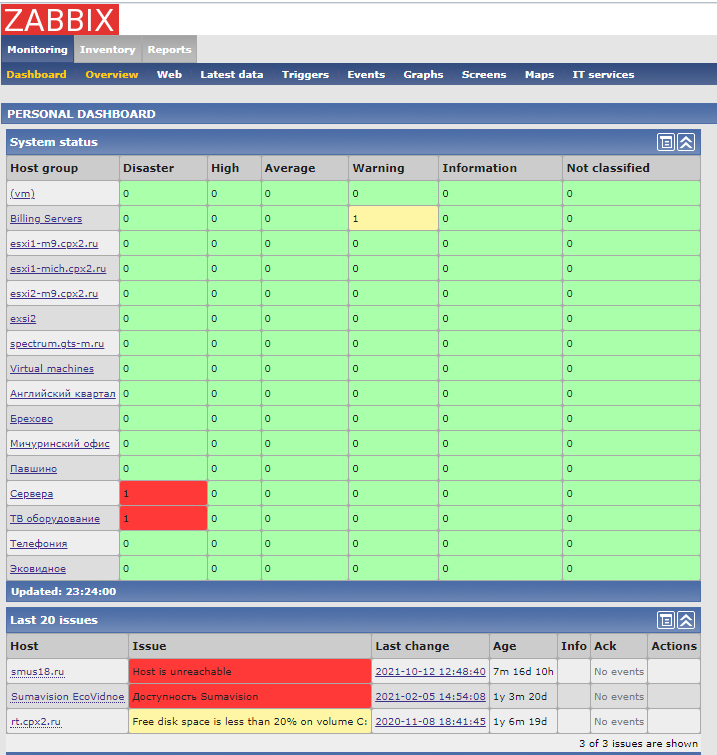
We learn that the systems are run on VMware, what is the logical division of the application, etc. We obtain information about addressing. This can be the basis for further exploration of this particular organization.
Grafana
As in the case of Kibana and Zabbix, the same Grafana, if unsecured, provides us with a lot of valuable information about the system infrastructure, addressing and resource usage. It is a base for further exploration.

The situation is even more interesting because we have the ability to create our own screens, where we can place control panels or multi-level monitoring. This is also the case with the most interesting example that was found in this scan run. It is a monitoring and control panel for heating devices.

I’ve seen various panels, mainly related to video surveillance, wind turbines or photovoltaics, but I haven’t found such one before. Since someone provides monitoring and buttons to perform various actions (on another panel), I suppose it may have an impact on the operation of physical devices. Therefore, we are entering a dangerous area, because the devices work with high temperature and pressure and it would be bad if they worked outside the parameters. Right?
Note: Some of the systems released to the public are either testing or abandoned systems. Some are clearly honey-pot systems. Most, that is, almost all, however, are production systems or will become production systems in some time. Regardless of their nature, they should not be available to the public, as it is against good practice.
Going to the end
Turkish cryptocurrency exchange
For the ones who managed to make it to the end of this article, there will be one more curiosity. Well, in 2021, when I made my first attempts to scan, in 200 territories I found something more interesting than the finds described here. The scanning did not cover Turkey, but the country where the Turkish cryptocurrency exchange was located. I found a log monitoring system that stored usernames and their passwords. This data allowed access to the accounts . That is why it is so important to inventory resources, check configuration and perform security audits.
Note: The system explorations described are just an example. They do not cover all possible services, or even analyze everything that has been identified. In no way was the obtained information and access used against anyone. Neither of the systems has been tampered with.
Contact
If you are interested in this article, please do not hesitate to contact me. I am open to various forms of cooperation, both commercial and non-commercial, in the field of infrastructure, architecture and security.
Leave a Reply