In case you have been low on disk space on your Elasticsearch instance, there is high probability that your indices are marked read only now. In order to fix this one, first either delete/archive indices or increase your disk space. After that restart Elasticsearch and Kibana and navigate to Management – Dev Tools and execute the following:
PUT /*/_settings
{
  "index.blocks.read_only_allow_delete": null
}
This should bring indices back to be writable once again.
Note: for more resilent setup install more than one Elasticsearch server node and enable basic security. For sake of clarity I will skip these two aspects which will be covered by another article.
Now be sure to configure both Elastic and Kibana. For Elastic it is /etc/elasticsearch/elasticsearch.yml configuration file. Be sure to set the following (change 0.0.0.0 with your local IP address):
sudo systemctl enable kibana
sudo service kibana start
Be sure to check if both Elasticsearch and Kibana are up and running with service or systemctl. If everything is fine proceed to setup Filebeat, Packetbeat on client hosts. There is separate guide how to do this. In beats configuration file point to Elasticsearch server you just installed.
HAProxy on pfSense
Example setup includes gateway, which is pfSense with HAProxy package. Configure two frontends, one for HTTP at 80 and one for HTTPS at 443. On HTTP frontend configure
Action http-request redirect
rule: scheme https
On HTTPS configure certificate and check SSL Offloading. Of course you need to load this certificate in System, Cert. Manager. Configure your backends and select it on HTTPS frontend. Now, go to HTTPS frontend and check the following:
Use "forwardfor" option
It is required to be able to read client IP in backend NGINX.
Filebeat on client host
On client hosts install filebeat package. There is separate guide for this one. Edit configuration file, which is /etc/filebeat/filebeat.yml:
filebeat.inputs:
  enabled: false
And then setup and enable NGINX module:
filebeat setup
filebeat modules enable nginx
Now, you are good to go with delivering log files, but first you need to point them in the configuration at /etc/filebeat/modules.d/nginx.yml:
You can use it in application configuration file at /etc/nginx/conf.d/app.conf in the server stanza:
access_log /var/log/nginx/app.log mydefault;
Restart your NGINX server and go to Kibana to explore your data. You need to add this log format, in order to handle client IP which is present in $http_x_forwarded_for variable. This format as close as possible to the default one.
Network geo location map
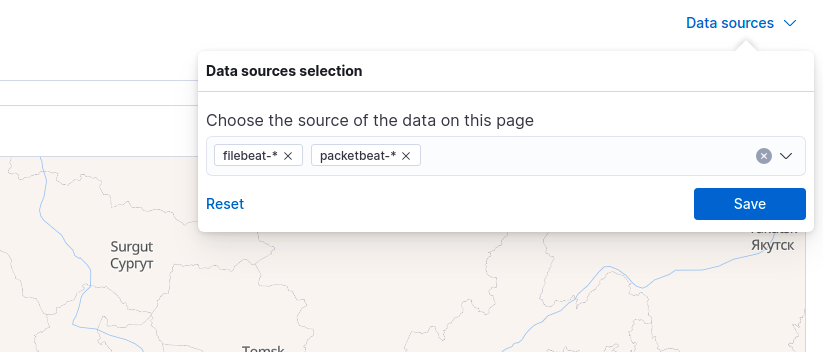
If everything went fine which is installting Elasticsearch, Kibana, beats on your client hosts and configuration of HAProxy, NGINX, then you can open Security, Explore, Network section and hit refresh buton to load data into map. But first you need to select Data sources (link above the map, on the right side), include filebeat-* index pattern.
Fig. Filebeat data source selection
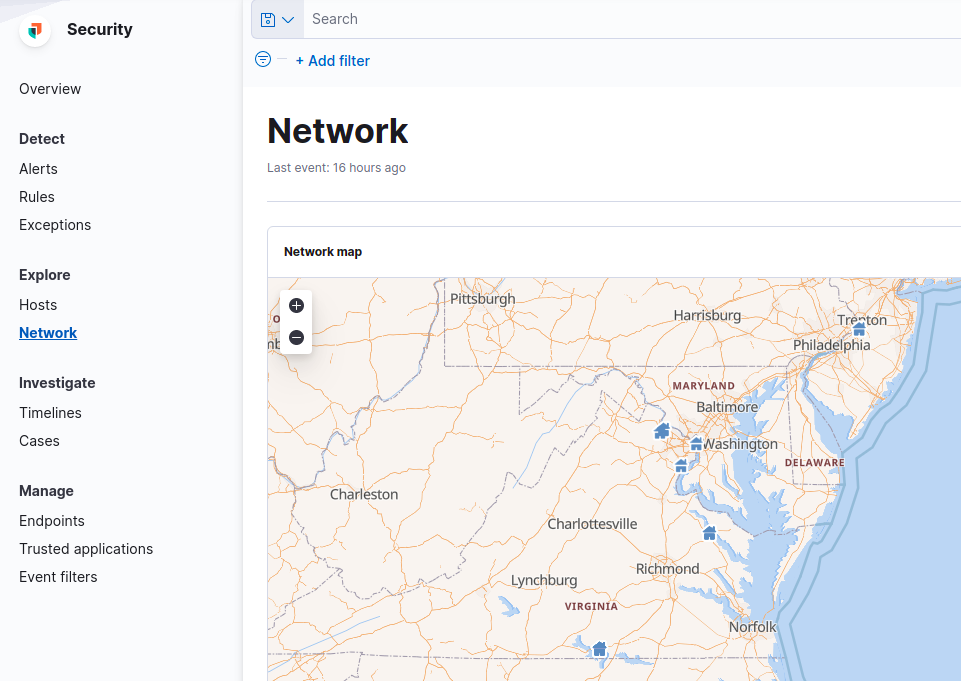
With such configuration you should be able to see geo points representing client locations.
Fig. Location points based on filebeat data
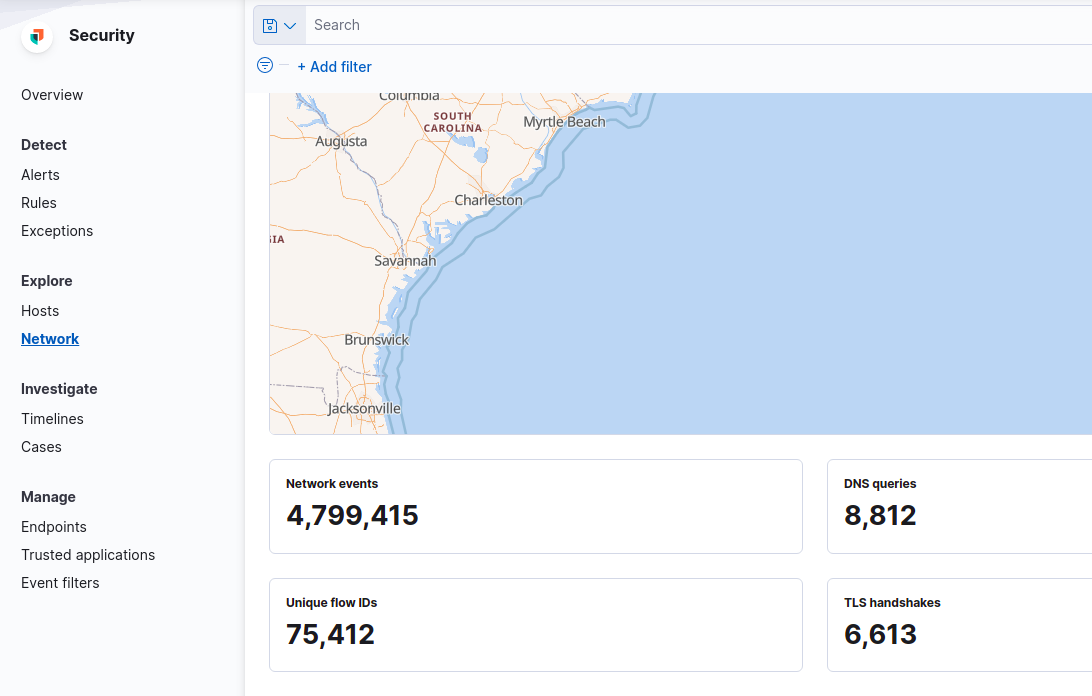
In case you also enable Packetbeat, you will see also networking information data below the map.
Fig. Networking information data
Please remember that enabling Packetbeat generates tons of data in complex environments, so be sure to allocate enough space for these indices.
Summary
This guide covers the basic path for installting Elasticsearch, Kibana, Beats and configuring HAProxy and NGINX to deliver traffic, logs to Elasticsearch and be able to visualize traffic as geo location points.
In case you encounted power outage or just blindly pressed restart button on your machine, there is high chance you will have some issues with your cluster. Mine has only one node, so there is no redundancy. If I lose indices then data is gone. Fortunately starting Elasticsearch and having red indicators not necessarily means data lose. I recently went that path. Log says that primary shards was missing. In such case you need to check if there are those indices listed:
curl -s 'localhost:9200/_cat/indices?v'
With that command look for red statuses. Internal mechanisms have this delay rule, so check every minute if count decreases. If not then instead od “indices” write “allocations” and you may have some unassigned indices. Now you can try this one:
It possible could re-enable allocation. Other failure factor could be low free space. You need to keep it above 15%. If you have more than one node, please check whether it is available and working.
Once you have installed Elasticsearch and Kibana servers you need to grab some data. First choice could be beats modules, either Metricbeat or Packetbeat. There is also Filebeat. Altough installation instructions are available at https://www.elastic.co/guide/en/beats/metricbeat/7.17/metricbeat-installation-configuration.html I found it useful to describe it separately as this page might just disappear out of a sudden.
After installation you need to change the configuration file at:
/etc/metricbeat/metricbeat.yml
Change Kibana and Elasticsearch output addresses. Then start the agent:
sudo service metricbeat start
In case this is the first time you are installing the agent against this particular Elasticsearch server you need to load visualizations and dashboard definitions:
metricbeat setup -e
Now you’re done and should be able to see you newly added host on Observability:Metrics:Inventory page. Remember to press Auto-refresh button.
Recently I’ve been tryout Elasticsearch 7 with Kibana and Metricbeat as well as Filebeat. I encountered some issues with indices so I dropped dashboards and visualizations and tried to load them again. I also cleared indices and patterns thru index management page. If you get error message like “could not locate that index-pattern” or something with fields being non-optimized then you should take few actions.
Please note that it was my lab Elastic installation so I do not care about deleting indices.
First you need to either stop all of your metricbeat modules sending data to the cluster or do some magic with the indices itself to prevent from auto-creating. Then delete all indices related to those two modules as well as its index patterns. Then go to Saved objects and delete all visualizations and dashboards. If you have custom things, then most probably you need to remember not to select them for deletion. If you have cleared out all of these you may go to sample machine with metricbeat node and run:
Effectively you will get a index alias and bare index pointing at each other. This is the main difference between manually creating pattern and letting metricbeat doing its things properly. Now you should have visualizations created correctly which means that also dashboads should work fine. Neither Elasticsearch 7 is working correctly nor messages are saying anything useful. Maybe version 8 brings little more in this aspect, but I thought that writing about this case might save some time for someone looking for similar issue happening on their environment.