Cassandra performance tuning

From 8k to 29k writes per second

We took IP2Location version DB11 database. It holds few millions of IPv4 ranges which should unwrap onto over 2 billion addresses. Such number of entries is actually not a big deal for PostgreSQL RDBMS or Apache Cassandra distributed databases system. However there is an issue of ingestion speed. The question is how quick I can programmatically compute IP addresses for IP ranges and insert them in persistant storage.

PostgreSQL can hold easily around 10TB of data in single node. It can hold even more especially if divided into separate partitions/tables or use multiple tablespaces with separate drives. In case of Apache Cassandra it is said that it can hold also over 10 TB per node. So lets check it out!

Cassandra keyspace and table definition

We start with defining basic non-redundant keyspace. Non-redundand because we want to know about data structure layout first.

create keyspace ip2location
with replication = {
  'class': 'SimpleStrategy',
  'replication_factor': 1
};

Table definition with only single partition key.

create table hosts_by_country_and_ip
(
  country varchar,
  ip varchar,
  region varchar,
  city varchar,
  lati varchar,
  longi varchar,
  izp varchar,
  timezone varchar,
  primary key ((country), ip)
);

With single partition key (country) and 6 Cassandra nodes (with default settings from Docker container) we get 8 – 9k inserts per second. It is way below of expected 20 – 40k inserts on modern hardware. However test setup is not run on modern hardware, it is actually run on HP Z800.

create table hosts_by_country_and_ip
(
  country varchar,
  ip varchar,
  region varchar,
  city varchar,
  lati varchar,
  longi varchar,
  izp varchar,
  timezone varchar,
  primary key ((country, region, city), ip)
);

Now with different table structure approach. Instead of single partition key, there are now 3 partition keys (country, region, city). Cassandra calculates partition key with token function which gives numeric result. By default each Cassandra node holds 16 tokens (token value ranges to be precise). Every insert calculates token value and coordinator places insert to appropriate node which holds the same token – holds data related to this token. With such a structure change, we get 16k inserts per second.

Why is that you may ask? It depends on data being inserted actually. So our ingestion Python program reads PostgreSQL IPv4 range and generates IP address list to insert into Cassandra. We did not put any kind of ORDER clause, so it may be or not be “random” data distribution. Effectively Cassandra write coordinator needs to solve too many conflicts/blockings because there are multiple runners inserting the same partition key data. If we spread out data we minimize conflicts solving computational time.

Cassandra node configuration

At first we tried to adjust table structure to increase writes performance. Next thing we can try on different hardware and with modified runtime parameters. So instead of HP Z800 (with SATA SSD drives) we run single Cassandra node on machine with single NVME drive. Created the same keyspace and the same table. With no change. Maybe there was a change, as single node outperformed 6 nodes, but we expect to have write thruput increased even more. No matter if this was 6, 12 or 24 Python ingestion instances running. We get up to 16k writes per second.

However additionally we set the following configuration values:

concurrent_reads: 64
concurrent_writes: 128
concurrent_counter_writes: 64

And increased MAX_HEAP_SIZE from 4GB to 8GB. We did not follow too much the documentation, but rather common-sense to increase write concurrency with arbirtary value. Run 24 Python ingestion instances and finally we got better results – 24k writes per second.

Measuring thruput

How to even measure write thruput easily? Cassandra do not offer any kind of analytics at that level. You need to manually created counters or use Spark to calculate count on token list. We choose the first approach. There are external counters which are updated with every Python runner. This way based on boolean logic, we can also achieve selecting data for concurrent processing.

Client-limited performance

Running only 12 Python ingestion instances gives over 18k writes per second. So there is link between server capabilities and running tasks inserting data. Increasing runners to 48 instances gives 28k writes per second. With 64 instances we got 29 – 30k writes per second. And I think is the max from the hardware and configuration at this time.

Reads vs Writes

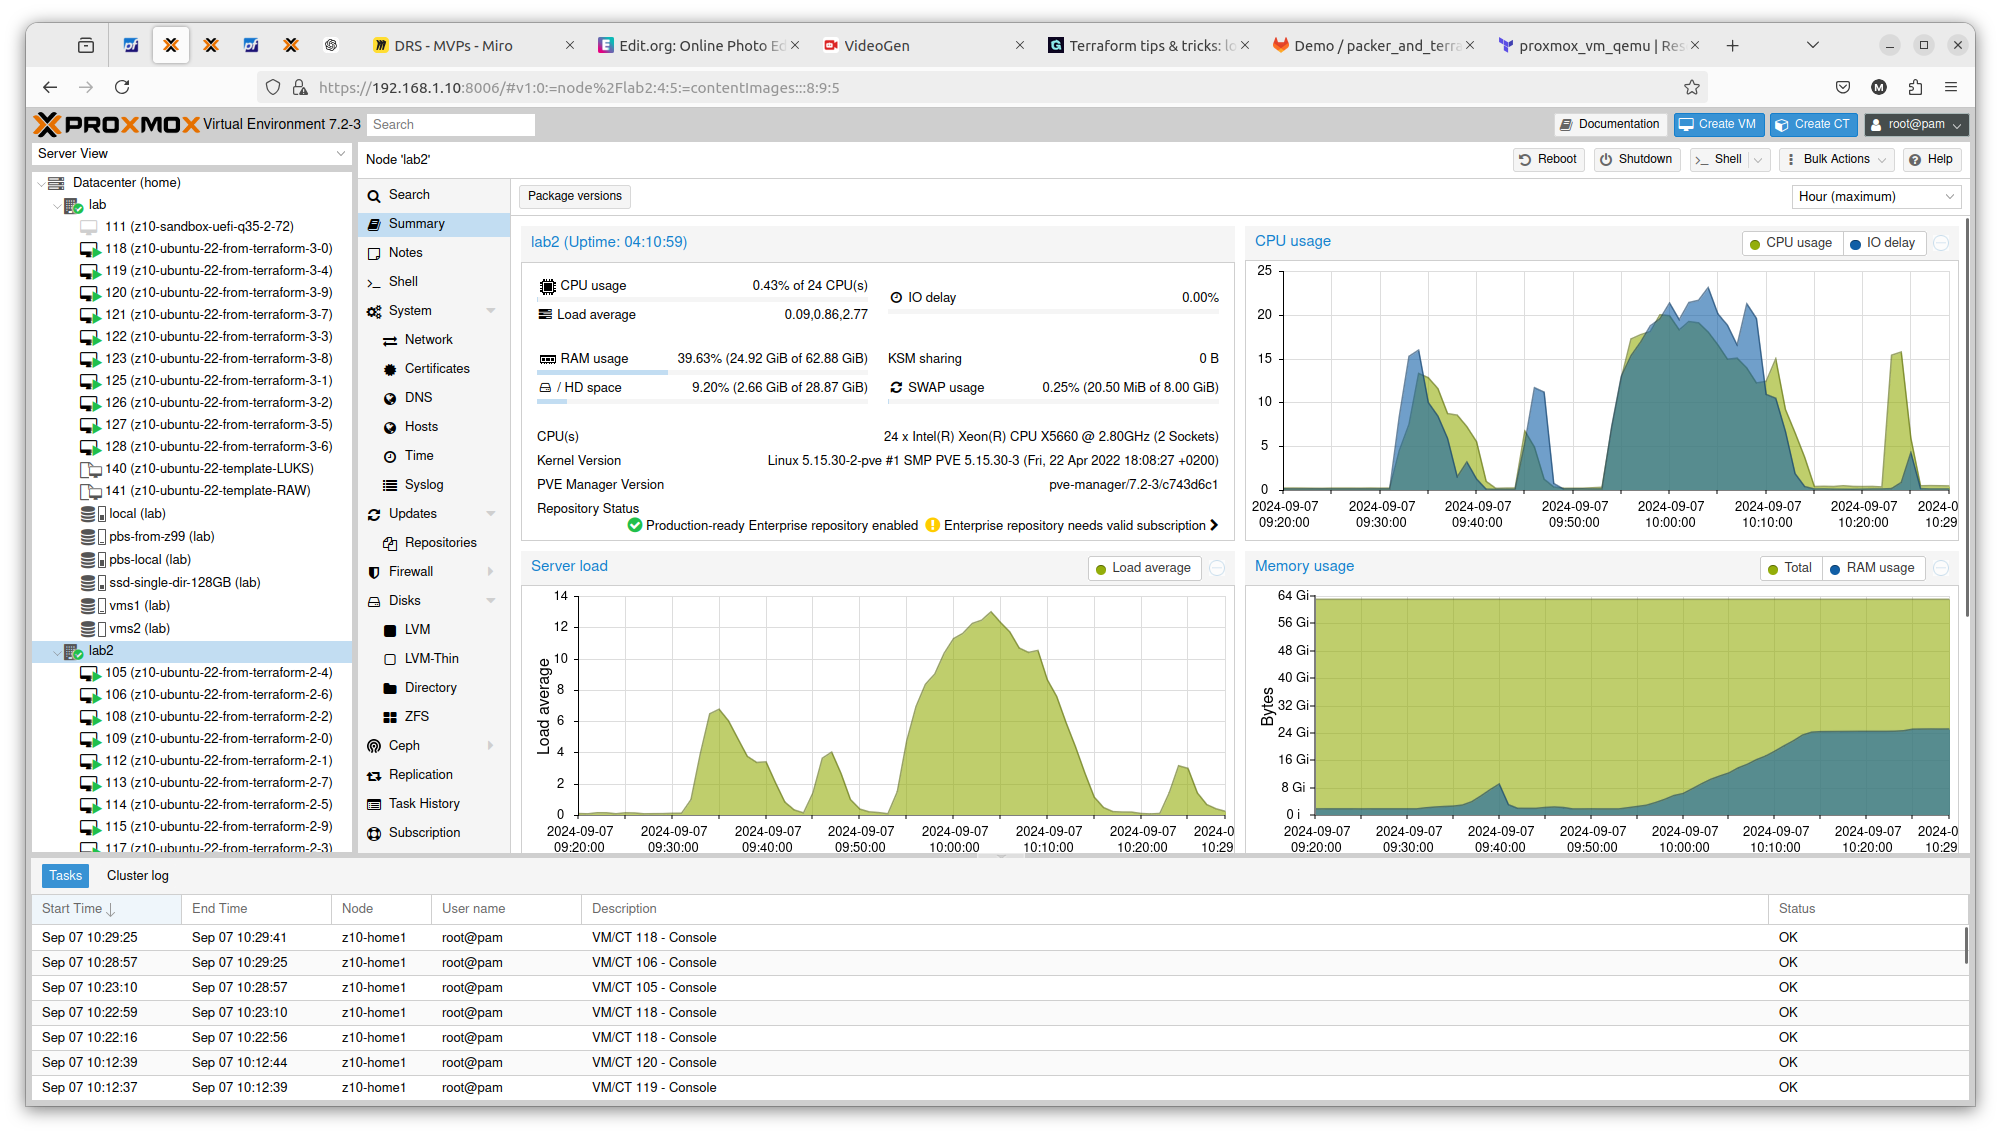
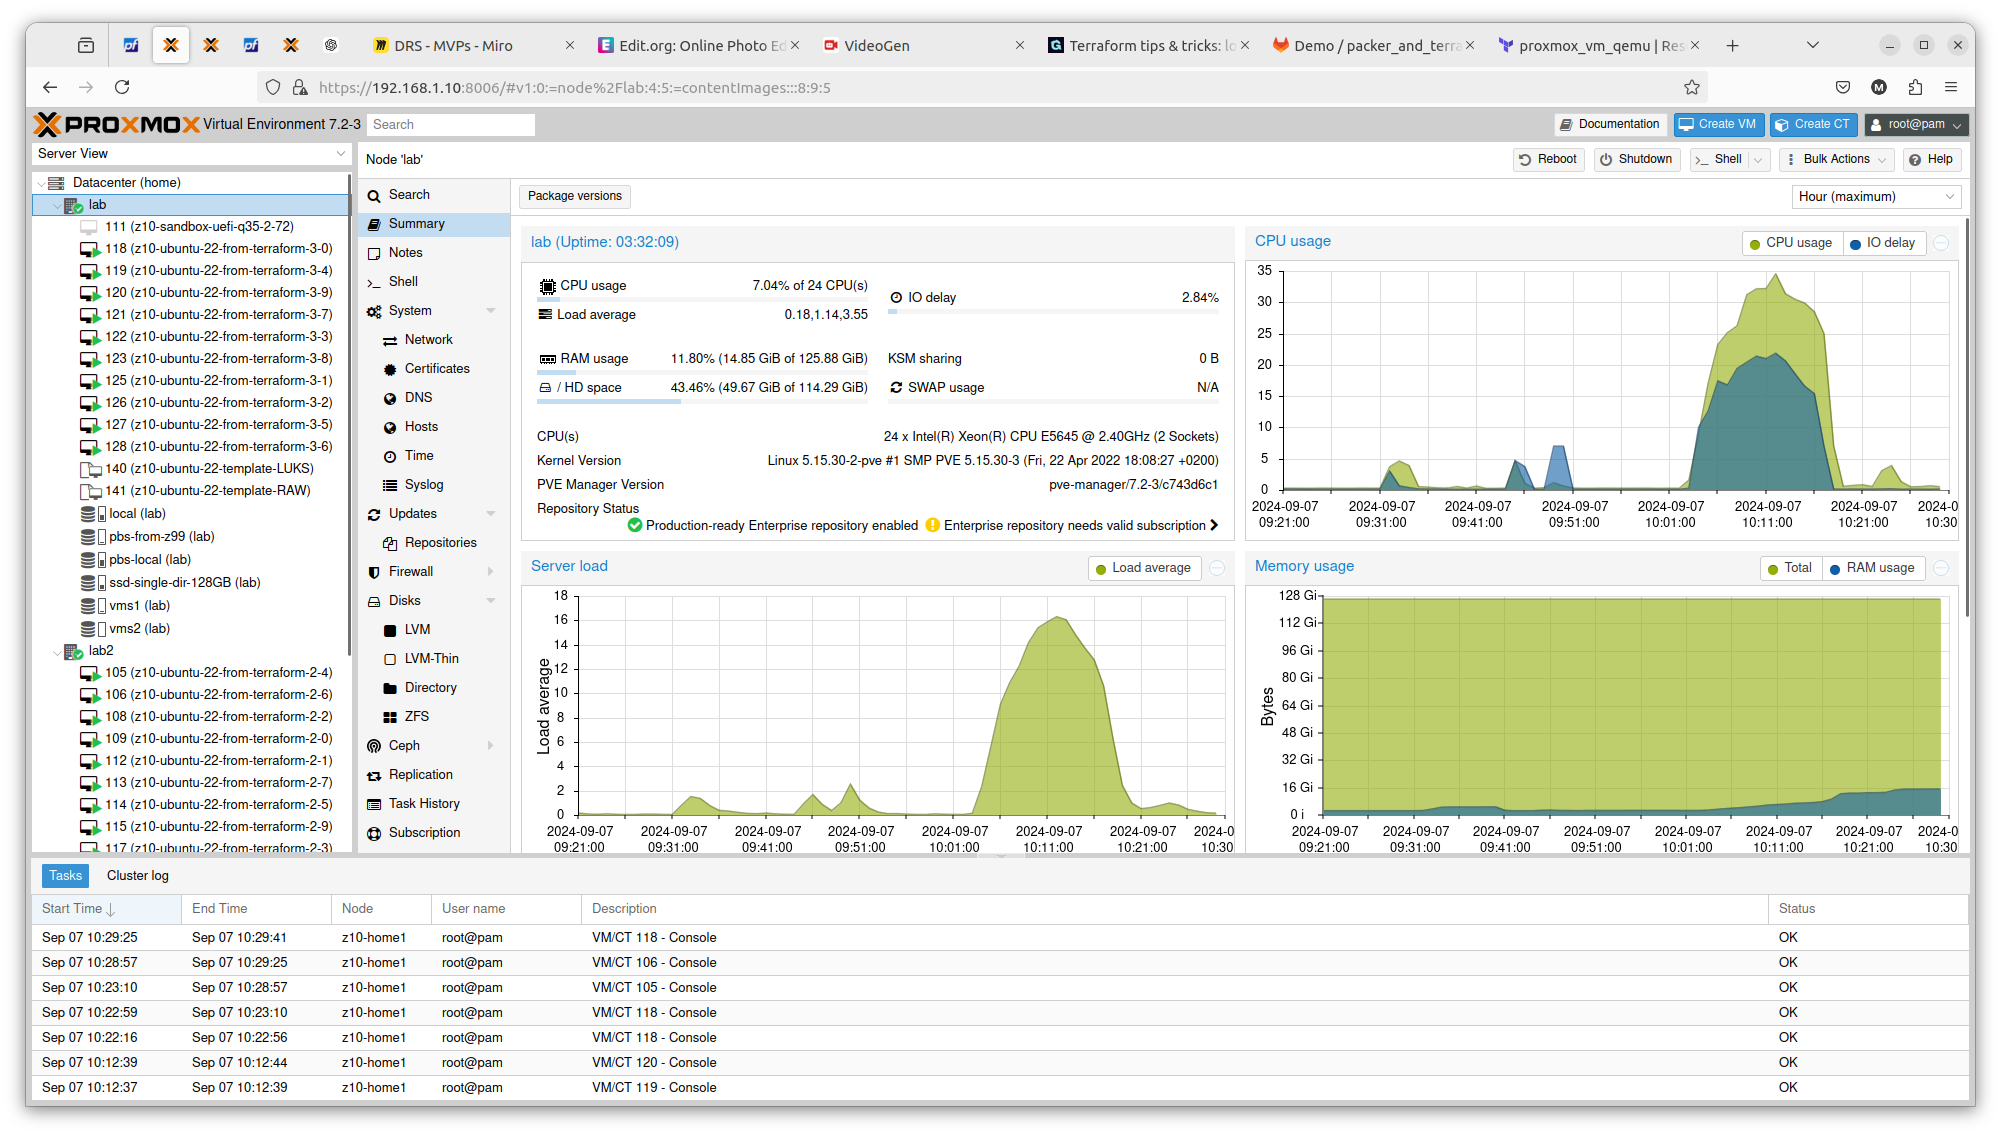
There is one more thing to consider regarding performance. During intensive writes (e.g. 12 ingestion instances) CPU utilization oscillates around 200 – 300% (on 4 core, 8 thread CPU). However during intensive reads, with lets say, 32 parallel processes running, we can see CPU utilization between 400 and 700%. It is the level unseen during writes.

...

# Function processing single partition
def process_single_partition(r):
    cluster = Cluster(['0.0.0.0'])
    session = cluster.connect() 
    session.execute("USE ip2location")
    stmt = session.prepare("SELECT ip as c FROM hosts_by_country_and_ip WHERE country=? AND region=? and city=?")
    res = session.execute(stmt, [r[0], r[1], r[2]])   
    counter = 0 
    for row in res:
        counter = counter + 1
    print(r, counter)

# Multiprocessing invocation
Parallel(n_jobs=32)(delayed(process_single_partition)(obj) for obj in records)

As both PostgreSQL and Cassandra sessions and not pickable by Parallel, we need to either use connection pool or simply create connection with each run. For this simple demo it is enough.

Due to distributed nature of Cassandra, we cannot simply run COUNT query. Even when using all the required partition columns. In this example those are country, region and city. Even with usage of all of them we will get timeouts running COUNT, and even if we do not run inserts during out counting procedure. Most probably, if we would enlongen particular timeout parameters we could get more results. Still using COUNT we will get some results, but it will not be reasonable way to actually count our records number. The proper one is to build structures holding data counters or use Cassandra diagnostics.

Notice: other possiblities to count are DSE Analytics, nodetool tablestats. DataStax Bulk Loader seems to be also interesting one.

More nodes and more drives

It is said that Cassandra scales easily just by adding additional nodes with additional drives preferably. Generally speaking it is true, but should also consider such parameters like server heap size, memory available and CPU performance. Even better performance will be achieved if storage backend will be constructed from multiple drives giving more IOPS. It is also important to remember that contrary to RDBMS, in Apacha Cassandra (Dynamo concept) we need to design structures by query usage and not by data organization.

1000 Docker containers in Swarm mode

I defined Docker Swarm cluster with 20 nodes and created service using Nginx HTTP server Docker image. I scaled it to 1000 container instances, which took a while on my demo hardware. Containers are up and running but to get such statistics from Portainer CE UI is quite difficult, so I suggest using CLI in such a case:

docker service ps nginx3 | grep Running | wc -l

I got exacly 1000 containers on my service named “nginx3”.

Hardware is not so much utilized, combined 2 servers RAM usage oscillates around 50GB, load stays low as there is not much happening, so even using 20 VM and Docker containers, we do not get too much overhead of using both virtualization and containers. What about trying to spin 2000 or even 10 000 containers… Well, actually without putting load on those containers, measuring it will not be too much useful. We can scale even up to 1 000 000 containers, but what for?

Deploy 20 x Docker Swarm nodes using Terraform and Ansible

If you wonder how to automatically deploy 20 nodes of Docker Swarm and run 100 Docker containers in it, then continue reading. I will show how to achieve this by using Terraform, Ansible and Portainer.

Course of action

  • Terraform 20 x Ubuntu virtual machines
  • Install Docker Swarm using Ansible
  • Install Portainer
  • Deploy 100 containers across Swarm cluster

What is Docker Swarm and why I need to have 20 of these?

Docker is containers toolkit utilizing cgroups, namespaces which allows to control and share resources of the CPU and operating system. Docker Swarm its a special kind of runtime mode, which allows to run multiple clustered nodes which can be separate physical computers or virtual machines. It gives us scalability and resource separation yet keeping it all within same management utitlities. You can make work much easier by installing Portainer CE, which is management UI for containers orchestration (de facto operations management).

So back to the question, why 20 of these? You can have single Docker Swarm node being both manager and worker and put loads of resources that you have, like CPU and RAM. But for sake of better maintanane, equal resources utilization and securing resources, you use clustered mode such as Docker Swarm with more than one node.

What is Terraform and Ansible and the whole automation thing?

Terraform is automation tool for automating construction of systems, for instance provisioning virtual machines. You can do it also with Ansible, but its role here is more like to manage already provisioned systems instead of provisioning themself. So both tool could be used possible for all the tasks, however Terraform which Telmate Proxmox plugin do it the easiest way. I use Ansible to automate tasks across resources created with Terraform. This is my way, your might be different.

Why to deploy 100 containers of the same application?

If your application perfectly handles errors and tools outages and it’s capable of running multiple processes with multiple threads and you know that will never be redeployed, then stick with 1 container. But in any of these cases, having muliple containers, instances, of the same application will be beneficial. You increate your fault-tolerance, make software releases easier. You need not bother that much about application server configuration, etc, because all of these is mitigated by deploying in N > 1 instances.

You can have 2 containers for frontend application, 2 containers for backend application, 1 application for background processing and many other composites of your single or multiple repositories. You could have 50 frontends and 50 backends, it depends on a case. You could introduce auto-scaling, which by the way is present in OKD, OpenShift, Kubernetes, but Docker Swarm and Portainer lack of such feature. It is unfortunate, but still you can do it yourself or plan and monitor your resources usage. In case of dedicated hardware it is not so important to have autoscaling, just overallocate for future peaks. In case of public cloud providers, when you pay for what you use it will be important to develop auto-scaling feature.

Terraform 20 Ubuntu VM

So in order to deploy more than one VM using Terraform and Telmate Proxmox provider plugin you need to either copy resource section multiple times or use count notation. I defined terraform and provider sections as well as two resource sections each for different target Proxmox server. By using count, you get ability to interpolate ${count.index} for each consecutive execution of resource. I used it for name and network IP address. Target server is differentiated using target_node. Be sure to use appropriate clone name and disk storage name at which your VMs will be placed.

terraform {
    required_providers {
        proxmox = {
            source  = "telmate/proxmox"
            version = "2.9.0"
        }
    }
}

provider "proxmox" {
    pm_api_url      = "https://192.168.2.11:8006/api2/json"
    pm_user         = "root@pam"
    pm_password     = "xxx"
    pm_tls_insecure = true
    pm_timeout       = 300
    pm_parallel      = 2
}

resource "proxmox_vm_qemu" "ubuntu_vm_xx" {
    count       = 10
    name        = "z10-ubuntu-22-from-terraform-2-${count.index}"
    target_node = "lab2" 
    clone       = "new-template"
    full_clone  = true
    memory      = 4000
    cores       = 2 
    bootdisk = "virtio0"
    network {
        bridge = "vmbr0"
        model = "virtio"
    }
    disk {
        storage = "single-dir-ssd-256GB"
        size = "10G"
        type = "virtio"
    }
    os_type = "cloud-init"
    ipconfig0 = "ip=192.168.2.${count.index}/22,gw=192.168.1.1"
    ciuser = "xxx"
    cipassword = "xxx"
}

resource "proxmox_vm_qemu" "ubuntu_vm_lab" {
    count       = 10
    name        = "z10-ubuntu-22-from-terraform-3-${count.index}"
    target_node = "lab" 
    clone       = "z10-ubuntu-22-template-RAW"
    full_clone  = true
    memory      = 4000
    cores       = 2 
    bootdisk = "virtio0"
    network {
        bridge = "vmbr0"
        model = "virtio"
    }
    disk {
        storage = "vms1"
        size = "10G"
        type = "virtio"
    }
    os_type = "cloud-init"
    ipconfig0 = "ip=192.168.3.${count.index}/22,gw=192.168.1.1"
    ciuser = "xxx"
    cipassword = "xxx"
}

With above notation you will create 10+10 Ubuntu VM. You can run it with:

terraform apply -parallelism=1

After VM are created you need to wait until cloud-init finshes its job. If you are not sure if its running or then, then reboot this VM so you will not get any stuck processes which could collide with the next step which is installing Docker with Ansible.

Install Docker service with Ansible

First we define the inventory:

[lab]
192.168.2.0
192.168.2.1
192.168.2.2
192.168.2.3
192.168.2.4
192.168.2.5
192.168.2.6
192.168.2.7
192.168.2.8
192.168.2.9
192.168.3.0
192.168.3.1
192.168.3.2
192.168.3.3
192.168.3.4
192.168.3.5
192.168.3.6
192.168.3.7
192.168.3.8
192.168.3.9

[lab:vars]
ansible_user=xxx
ansible_password=xxx

Second of all, we define and run installation of required packages:

---
- name: Docker reqs installation
  hosts: all
  vars:
    ansible_ssh_common_args: '-o ServerAliveInterval=60'

  tasks:
    - name: Install aptitude
      apt:
        name: aptitude
        state: latest
        update_cache: true

    - name: Install required system packages
      apt:
        pkg:
          - apt-transport-https
          - ca-certificates
          - curl
          - software-properties-common
          - python3-pip
          - virtualenv
          - python3-setuptools
        state: latest
        update_cache: true

And finally insallation of Docker itself:

---
- name: Docker installation
  hosts: all
  vars:
    ansible_ssh_common_args: '-o ServerAliveInterval=60'

  tasks:
    - name: Add Docker GPG apt Key
      apt_key:
        url: https://download.docker.com/linux/ubuntu/gpg
        state: present

    - name: Add Docker Repository
      apt_repository:
        repo: deb https://download.docker.com/linux/ubuntu jammy stable
        state: present

    - name: Update apt and install docker-ce
      apt:
        name: docker-ce
        state: latest
        update_cache: true

    - name: Install Docker Module for Python
      pip:
        name: docker

We could include those steps into Packer configuration and that way Docker with its requirements would be included by default. However it is good to know not only Packer and Terraform, but also how to run it from Ansible.

Configure Docker Swarm and join cluster

I decided to configure single manager with Portainer, so I picked 192.168.2.0 for this job:

sudo docker swarm init
curl -L https://downloads.portainer.io/ce2-21/portainer-agent-stack.yml -o portainer-agent-stack.yml
sudo docker stack deploy -c portainer-agent-stack.yml portainer

Now we have Docker Swarm initialized, installed Portainer stack. After initializing Swarm mode you get a token for nodes inclusion. You can join more manager nodes, but for simple installation demo you can stick with single one and join additional 19 worker nodes, by using Ansible command:

ansible all -i inventory -m shell -a "sudo docker swarm join --token SWMTKN-1-4ph10h6ck7aqonnr7bunok3be63nl7itnjkua4owm0cvmyh2z1-754wirc3y36igf86porgwtbjh 192.168.2.0:2377" --become -o -f 1

In portainer there is cluster visualizer, where you see all nodes and what is inside of them:

Running containers workloads

Using Portainer CE you can scale service instances, ie containers by just entering number of Docker container ro run. You can either run replicated mode, where you explicitly define how many container you would like to start, or you can use global mode, where number of containers will automatically equal number of nodes in your Docker Swarm cluster.

Docker Swarm scheduler will try to place containers equally according to service definiotion and hardware capabilities. You can try gradually increase number of instances and monitor hardware resources usage. There is whole separate topic regarding deployment webhooks, deployment strategies etc.

Performance comparison scenario

Installation is initialized by terraform init -parallel=1 command. On older hardware I suggest go for one-by-one strategy, instead of high parallel leve which could lead to some unexpected behavior like disk clone timeout or other issues.

With that step done we can see how those two Terraform resource sections transformed into 5+5 virtual machines on two Proxmox nodes. Terraform keeps track of the baseline/state of your deloyment, however, it is not 100% safe to rely on it only. It is good to double check the results. In my tests I experienced situation when Terraform said that it destroyed all the content, but it did not actually. Same with resources creation, even if you are told here that everything is done be sure check it out. The problem may lay within at least 4 places, which are Terraform itself, Telmate Proxmox provider, Proxmox golang APIa and finally Proxmox itself with its hardware and software.

Both with apply and destroy you will be shown the proposed changes based on your configuration, you can then review what is going to happen and if this fits your needs:

It is crucial to know on what hardware you are working on. At least from performance perspective. In case of Proxmox VE and bare-metal hardware what you see is what you get. But this strategy can be also applied on many other platform providers, yo can what brings the specific AWS or Azure virtual machines. So to illustrate it, I compared Server load between 2 Proxmox nodes within the same cluster. Here is one with 2 x Intel Xeon X5560:

And here you have 2 x Intel Xeon E5645:

You can see exactly that difference in terms on CPU theoretical performance is confirmed in real scenario. The first server gets load up to 14 and the second one up to 16. There is also difference in terms of RAM usage. Same goes with drives performance. All those factors can be important if running plenty of Ansible or Terraform tasks concurrently.

Conclusion

With Terraform, Ansible and even Packer, you easily deploy multiple virtual resources and scale your applications deployment.